Capitalizing on Uncertainty: Your Guide to Sideways Market in Crypto
Unravel the enigma of a sideways market, learn potent strategies to turn uncertainty into profit, and discover how Bitsgap's GRID bot can be your ace in the hole.
Dive into our guide on the sideways market to unravel the intricate dance of grid and range-bound trading and learn how to strategically profit during crypto's quieter times.
In investing, each market condition dances to its unique rhythm. Some, like the bullish and bearish markets, are bold and dramatic; ever the center of attention. Then, there's a different beat that often goes unnoticed amid all the flamboyance — the steady, rhythmic sway of the sideways market. In the world of cryptocurrency, this dance can be as intricate and nuanced as its more ostentatious counterparts.
The sideways market in crypto is an interesting phenomenon because the price action neither breaks into a bullish run nor succumbs to a bearish descent, but instead — oscillates within a certain range. It's a scenario that requires patience, a keen eye, and, most importantly, a well-devised strategy.
In this article, we will demystify the concept of a sideways market, illuminate the mechanics of range-bound and grid trading, and teach you the moves for various sideways market strategies in the cryptoverse. So, brace yourself as we navigate the steady ebbs and flows of the sideways market in crypto.
What Is Sideways Crypto Market?
A sideways market (Pic. 1), often termed a ranging market, represents a trading landscape where the price action oscillates within a horizontal axis, marking the boundaries with peak and trough prices. This market scenario is distinguished by fairly consistent upper and lower trading limits for assets.
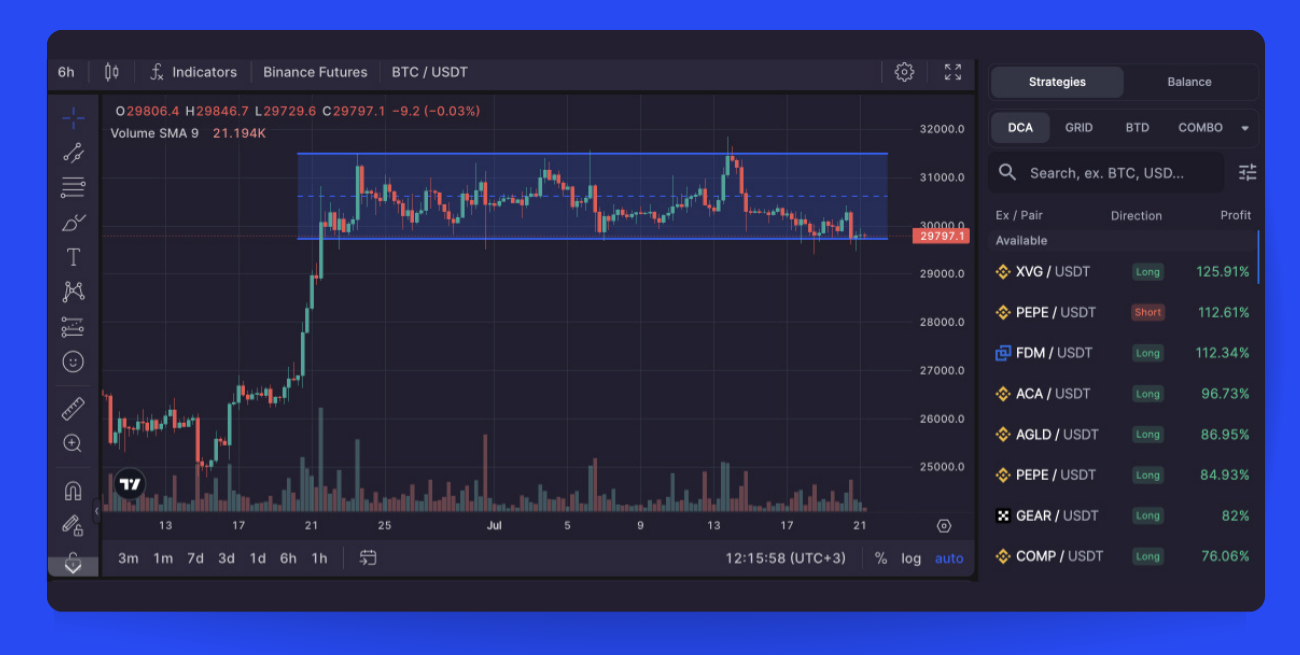
Characteristics of Sideways Market
The traits that define a sideways market encompass:
- Minimal or non-existent substantial price movement in an upward or downward trajectory
- Absence of an apparent trend
- Price oscillations confined within a relatively tight range
- Enhanced volatility, demonstrated by prices ricocheting between resistance and support thresholds
- An indistinct direction or momentum
- Reduced trading volume with fewer newcomers entering the buying or selling market
- A prevailing sentiment of caution among investors and traders, leading to a "watch-and-wait" approach
It's crucial to understand that a sideways market may persist for an extended period, and forecasting its directional shift can be challenging.
How Does a Sideways Market Work?
A sideways market is characterized by relatively flat price fluctuations that arise when the forces of supply and demand reach a near equilibrium over a certain timeframe. Such a scenario typically unfolds during a consolidation phase, preceding the continuation of an existing trend or the emergence of a new one.
These consolidation phases often serve as necessary intermissions during prolonged trends, given the impracticability of maintaining large price movements over a long-term horizon.
Trading volume, a critical market indicator, tends to remain steady during a sideways market due to a balanced presence of bulls and bears. It can spike in one direction when a breakout or breakdown is anticipated.
While scrutinizing sideways markets, you must consider different technical indicators and chart patterns to gain insights into potential price directions and the likelihood of upcoming upward or downward movements.
How to Identify a Sideways Trend?
To discern whether a trend is on a pause, there are certain telltale signs to watch for. For starters, both volatility and trading volume will start to diminish. The price action will be confined within a narrow band, a pattern that becomes increasingly evident over time.
Technical indicators like Bollinger Bands will exhibit a 'squeeze' or a narrowing effect, and the Ichimoku baseline will exhibit a flattening trend during these phases. Furthermore, the price action tends to hover around moving averages during this period, potentially resulting in numerous crossover points that can muddle the analysis.
To filter out this confusion, the use of the Average Directional Index (ADX) could be beneficial as it directly reflects the strength of a trend. An ADX score below 20 suggests an absence of a trend, implying that sideways consolidation could persist.
Lastly, the presence of a 'doji' candlestick, which signifies market indecision, can also indicate a lack of a trend on high timeframes. For instance, a doji appearing in a monthly candlestick chart implies a month's duration of sideways price movement.
Profiting in Stagnant Markets: Sideways Market Strategies
Here are three strategies to capitalize on a stagnant market:
- Staking: If you have unused assets, consider staking them to earn interest. This process usually provides better interest rates than standard banks and can create a lucrative passive income stream. By staking, you also contribute to the network's security, making it more robust and secure.
- Lending: Various lending protocols across different blockchain networks can be another way to monetize your assets. Although the interest rate is typically lower than staking, lending doesn't necessitate freezing your assets as some staking systems do.
- Trading: Profiting from trading in a flat market is possible by short-selling at peaks and going long at troughs. However, it's not as simple as it sounds. Studies indicate that nearly 90% of day traders lose money, so it's crucial to trade only if you know what you’re doing. Luckily, numerous proven trading strategies and automatic tools are available that can increase your chances of turning a profit amidst uncertainty.
Let's delve into some widely used trading tools and strategies.
Range Bound Trading
Range-bound trading is a strategy whereby traders leverage stationary markets by pinpointing significant support and resistance levels. This way, you purchase assets when they hit the support level and offload them at the resistance level, earning gains from the price fluctuations within these two points.
👉To illustrate this concept, consider an asset that has consistently moved between $100 and $110 in recent days. Range-bound strategy traders would buy the asset at $100 (support) and sell at $110 (resistance).
While the potential returns may be lower than correctly predicting a breakout, it's worth noting that markets do not always trend continuously in one direction. They might pause and move sideways before resuming a previous trend, or they could be in a state of uncertainty before opposing forces trigger a reversal.
Below are a few variations of range-bound trading strategies:
- Spot trading: Once the range is identified, the most direct strategy is to place a buy order near the support level and a sell order near the resistance level.
- Breakouts and breakdowns approach includes placing stop-loss orders near the asset's support and resistance boundaries. The aim is to reduce the risk associated with incorrectly timing a breakout or experiencing a downward breakdown.
- Automated tools provide an easy way for traders to make money from sideways markets without needing to actively place orders. A good example is Binance's Range Bound product. When you subscribe to Range Bound, you stand to gain rewards if the asset remains within the predefined price range throughout your subscription period. However, if the asset reaches or surpasses the set price range, you will receive an amount less than your initial deposit.
GRID Trading
In this strategy, you set buy and sell orders at regular intervals both above and below a certain price. The market becomes, in effect, split into a grid, and as the price fluctuates up and down, it triggers these orders, enabling you to earn profits. The GRID trading strategy’s profitability arises from market volatility and price fluctuations, rather than from a specific market trend. Yet, the sideways market offers a propitious ground for fluctuating price movements which could be manna from heaven for GRID trading.
Differences between GRID and Range-Bound Trading:
Although both strategies can be employed in a stagnant or range-bound market, they differ in their foundational assumptions and approaches:
- Range-bound trading operates on the premise that the price will persist in moving within a distinct range, rebounding off the pre-established support and resistance levels. Conversely, GRID trading does not hinge on the price remaining within a specific range and can be theoretically implemented in any market condition. However, certain bots like Bitsgap’s GRID bot are specifically designed to profit from a horizontal market (more on it in the next section).
- GRID trading is typically more automated and can carry out numerous trades in a short span due to the grid-like arrangement of buy and sell orders. Conversely, range-bound trading usually entails fewer trades and may demand more active involvement and decision-making from traders.
- GRID trading can potentially yield profits regardless of the market's direction as it exploits market volatility. In contrast, range-bound trading primarily profits from the predictable back-and-forth movement of prices within a certain range.
Bitsgap’s GRID Trading Bot
Bitsgap’s GRID bot operates with deferred limit buy and sell orders set at predetermined price intervals. The selected price range is segmented into several levels, thus forming a grid. All the grids are interchangeable; for each completed buy order, the bot will place a new sell order above the executed price, and vice versa.
Here’s how to get started with the GRID bot (Pic. 2) on Bitsgap:
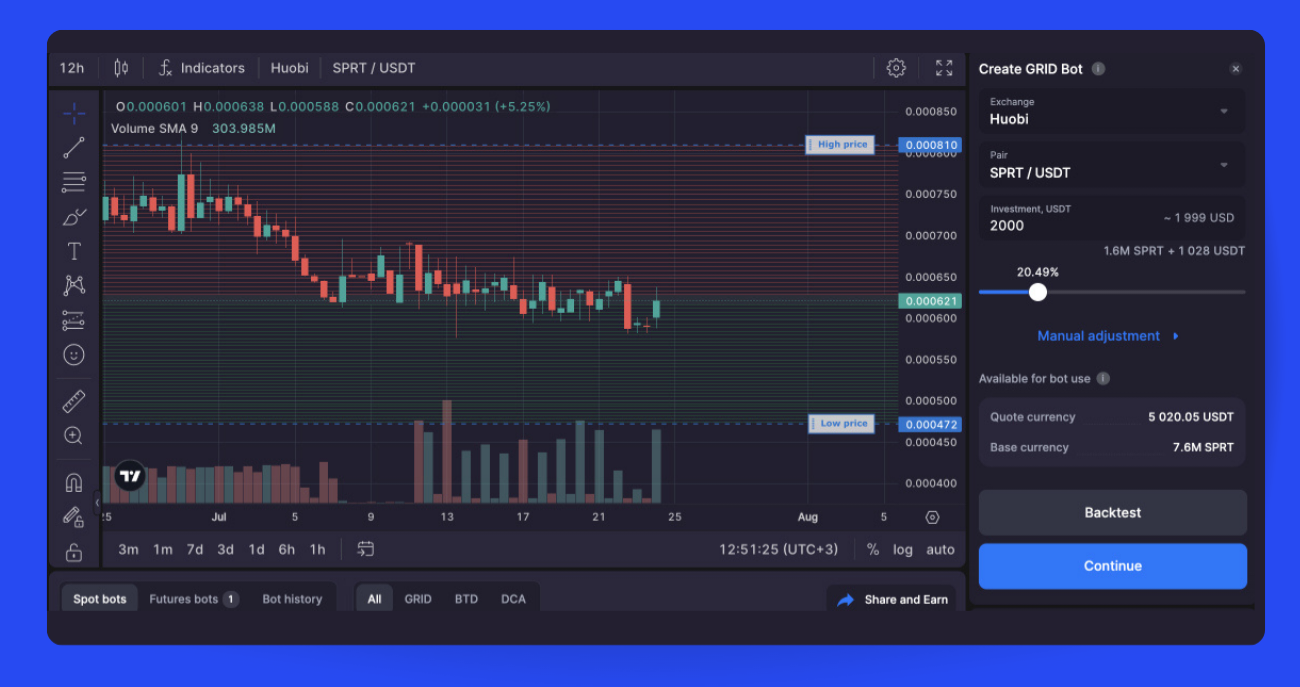
- Click [Start New Bot] at the top of the interface and select [GRID Bot] from the options.
- On the bot launch screen, choose an exchange and trading pair.
- Enter your investment amount or use the slider to allocate a percentage of your balance. This shows the approximate investment, required base and quote currencies for orders.
- The [Available for Bot Use] window displays your available base and quote balances, minus a 5% reserve for fees.
- Optional: Backtest your bot settings against historical data to optimize performance.
- Review all selected settings and make any final tweaks.
- Click [Start Bot] to launch your automated grid trading strategy.
Should you want to tamper with GRID bot’s default settings, click on [Manual adjustment] before starting your bot (Pic. 3):
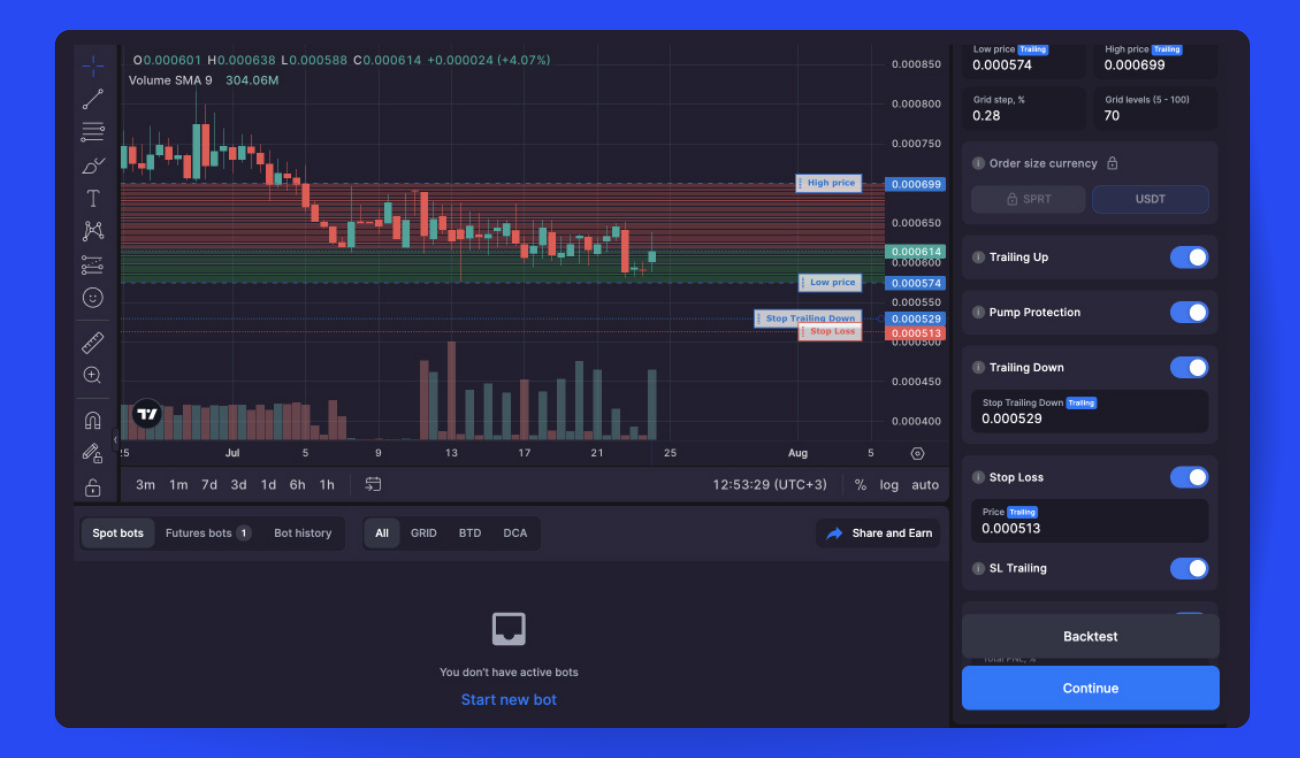
- Set High and Low Prices: By default, the upper and lower price limits are set at a 50:50 ratio around the current price. You can manually adjust the range based on your strategy.
- Grid Step and Levels: The "Grid Step" is the price distance between orders. "Grid Levels" is the total number of orders. Wider steps mean less frequent but more profitable trades. Narrower steps lead to more frequent, smaller trades.
👉 Balancing the velocity and the value of the generated profit is vital for a successful bot. Depending on the market conditions, different settings will need to be applied:
— If the market is highly volatile, a broader grid should be deployed.
— If the market is stable, then a grid in a narrow price channel will be optimal for maximizing the profit from the market.
- Fixed order size: You can choose fixed order sizes in the quote or base currency.
By default, a grid bot places orders in fixed amounts of the quote currency. This evenly divides your total investment across all grid levels.
As the price drops, the value of the base currency falls, allowing the bot to buy more coins for the same quote currency amount. However, as the price rises, the fixed quote order size limits how much base currency the bot can purchase.
👉 Tip: This fixed quote order approach works well if you expect the price to trade sideways.
Alternatively, you can choose fixed base currency order sizes. This requires more upfront investment to fund the grid, but allows the bot to capture much more profit in an uptrend.
👉 Tip: Fixed base order sizes make sense when you anticipate a strong upward price trend. The bot can accumulate more base currency as the price climbs.
- Trailing Features: "Trailing Up" moves the grid up as the price rises. "Trailing Down" extends the grid downward as the price falls. Use caution as these increase risk exposure.
- Pump Protection: This prevents buying at peak prices during pumps when trailing is active. Keep enabled to limit volatility risks.
- Take Profit and Stop Loss: Close the bot at a set percentage gain or loss to lock in profits or limit downside. Stop loss becomes dynamic if trailing up is enabled.
As evident from the above, Bitsgap's GRID bot is primarily structured to perform efficiently in a sideways market. However, by selecting fixed base currency order sizes, you can also reap benefits during an upward trend.
In general, GRID trading provides a straightforward, time-tested approach that can yield significant long-term results. But its effectiveness may decrease or lead to major losses during strong trend reversals. Understanding the right times to start and stop your bot is crucial. GRID trading is profitable when prices oscillate, but large trend swings can hurt your portfolio.
Bitsgap’s GRID Bot Sideways Example
Without further ado, let’s go straight to the example below, SPRT/USDT (Pic. 4), to see how to accumulate profits on confirmed uptrend formations.
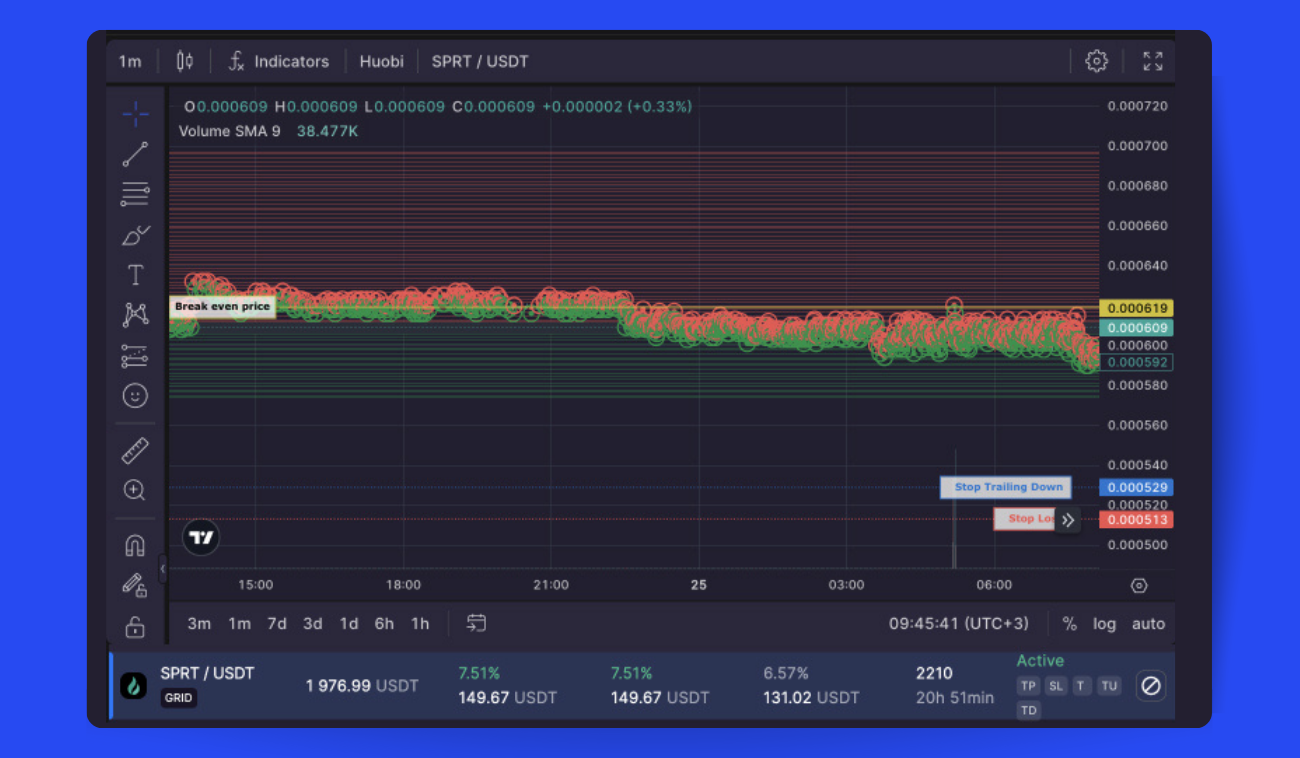
The chart clearly illustrates that SPRT/USDT has generated an extra profit of 7.51% in the quoted cryptocurrency, USDT, and a 6.57% increase, reflecting the shift in investment value due to market dynamics.
Green and red circles are used to denote executed BUY and SELL orders, respectively. These visual markers for both order types provide a way to track the GRID bot's operations.
The sheer speed of trade execution is akin to lightning — something that would be a Herculean task in the realm of manual trading. Imagine being chained to your computer screen, day in and day out, your fingers flying over the keys as you strive to keep up? And don't forget the cunning adversary, the trading fee, lurking in the shadows!
In essence, the quest for profitable and efficient manual high-frequency trading might feel akin to chasing the wind, given the lightning-fast pace of price fluctuations. However, the game changes with Bitsgap’s GRID bot. A simple nudge to the settings to suit your preferences, and voilà! You're set to trade at a rhythm that resonates with your comfort, turning the impossible into the everyday.
Bottom Line
Also known as a sideways drift, a horizontal or stagnant market happens when a coin’s price sways over time within a relatively stable boundary, without showing a clear allegiance to any trend. It's like a seesaw game, where the price action oscillates in a horizontal scope, neither giving the upper hand to the bulls nor to the bears. Trading under such conditions can feel like walking a tightrope, yet, with the use of certain strategic options, it's not only possible but can also prove profitable.
The art of recognizing reversal, sideways, and trend continuation formations is an acquired skill, honed with practice and time. As your trading journey unfolds, Bitsgap remains committed to guiding you through trading strategies and the compelling advantages of automated trading. Because even in the seemingly monotonous world of a sideways market, there's a world of opportunities waiting to be discovered.
FAQs
What Is Range-Bound Trading?
Range-bound trading involves buying and selling an asset within a set price range. It relies on identifying levels of support and resistance that act as price floors and ceilings.
To implement this strategy, traders will:
- Buy when the price drops to support, anticipating a bounce back up
- Sell when the price rises to resistance, expecting it to then fall back down
The goal is to profit as the price oscillates between support and resistance.
However, careful monitoring is required, as a breakout beyond the range signals a potential trend shift. Traders must prepare for breakouts which could invalidate the trading range.
What Is Cryptocurrency Range Trading?
Range trading is a crypto strategy where you buy and sell within a set price range over time. You identify support and resistance levels that tend to stop price drops and surges. The aim is to profit as the price swings between support and resistance. You buy around support and sell around resistance.
Range trading crypto carries substantial risks due to high volatility. Prices can shift quickly, invalidating expected trading ranges. It's crucial to fully grasp the strategy and manage risks prudently before attempting range trading. Using automated tools, hedging features, and close monitoring might help eliminate unnecessary risks.
How to Profit in Sideways Markets?
When prices consolidate into a trading range, the following strategies can potentially generate profits:
- Range trading involves buying near support and selling near resistance of the identified price channel.
- Staking provides rewards for holding coins to support a blockchain network's operations. It generates returns even in sideways markets.
- Yield farming/liquidity mining pays interest or fees for lending to decentralized finance pools through smart contracts. Rewards accrue regardless of market direction.
- Accumulating means steadily buying more of a cryptocurrency you believe in while the price is relatively stable.
Each strategy carries risks given crypto's volatility. Markets can shift rapidly. Do thorough research and assess your risk tolerance before employing these tactics.