How to Read Crypto Candles and Use Them for Profitable Trading
Want to learn how to read crypto candles? Tag along as we explore various candlestick patterns and types.
Let’s talk about crypto candles. Those who master a crypto candlestick chart and its various patterns can not only increase their profits but also mitigate their risks.
What do you think a kid driving a Lambo has in common with a Japanese paddy merchant of the 18th century? More than you might imagine! Surprisingly, both might have benefited from tech analysis and, specifically, from using candlestick charts to scour the market for profitable opportunities.
Although substantially updated since the 1800s, the underlying principles of candlestick charts remained remarkably the same. Those who practice regular tech analysis can attest to its vital importance and precedence even over such fundamentals as news or quarterly earnings.
👉 In other words, looking at charts and discerning patterns can be of tremendous help as nothing more accurately represents the market sentiment than the asset’s price.
The question is then — how do you read the chart and what is exactly a candlestick pattern?
This short article on crypto candlestick charts will help to clear up some of the confusion surrounding the patterns and give useful suggestions for conducting your own in-depth tech analysis.
What Are Crypto Trading Candlestick Charts?
The Japanese came up with candlestick charts almost a century before the Westerners developed bar and point-and-figure charts. But back in the 1700s, a Japanese man, Homma, was busy at work.
While Homma observed the rice market, he discovered that even though the price of rice was linked to its supply and demand, the market was still highly affected by merchant sentiment. To visually represent that correlation, Homma came up with a highly unusual method — charting candles to gauge market sentiment and predict future price action.
Thanks to his resolute determination to develop this ingenious analytical method, we still use candlestick charts to this day.
The range of colors used in candlestick charts represents the range of investor sentiment at the time. Based on recurring patterns, traders use candlesticks to forecast the short-term movement of prices.
👉 You can think of candlesticks as tiny slices of the same pie — a smaller representation of an overall chart. By carefully observing candlestick patterns, you can learn a lot about how buyers and sellers really feel about an investment.
Intrigued? Let’s find out what a candlestick consists of.
Parts of a Candlestick or How to Read a Crypto Candle
A candlestick is a graphical representation of the open, close, high, and low prices of an asset during a certain time period (Pic. 1). In this piece, by “asset,” we’ll mean any type of cryptocurrency, be it a token or coin.

The "open" of a candlestick depicts the price of an asset at the start of the trading period, while the "close" depicts the price at the end of the period. For a given trading session, "high" and "low" refer to the highest and lowest prices, respectively.
There are two visible parts on each candlestick that show the four primary parts. The first part of the candlestick is its broad middle, or "body," which represents the opening and closing prices for the chosen period.
The “open” is represented at the bottom of the body in the green candle and at the top of the red candle. The “close” is the polar opposite — the top of the body in the green candle and the bottom in the red candle.
The wick, which contains the candlestick's two final components, stands in for the high and low. Wicks are thin lines that extend from the body either upward or downward.
👉 Those traders who prefer to capitalize on the crypto market's natural volatility prefer the intraday time frames.
While commonly, each candle represents one, two, four, or 12 hours, HODLers would generally focus on candlesticks that cover a longer period, such as a week or a month.
When the current or closing price is higher than the opening price, the crypto candlestick is said to be "bullish" or green. For a candlestick to be "bearish" or red in color, the closing price must be lower than the opening price.
How Do Crypto Candles Work and How Do You Use Them Correctly?
You need to study the various candlestick types and patterns before you can effectively use them. Even though crypto candlesticks may seem identical to the untrained eye, they provide different information.
👉 For example, certain candlestick shapes always correspond to a certain point in a price trend.
Recognizing these shapes, patterns, and types can be very profitable because they tell you if a trend will change, stay the same, or reach a point where the market is very uncertain.
Trading Crypto Candlestick Types
The "doji," "hammer," and "shooting star" are three of the most helpful candlesticks for spotting a possible trend shift or measuring market sentiment.
- Doji
When investors say that candlesticks accurately reflect the current market mood, they often refer to the doji as an example. If the coin’s price fluctuates in both directions before settling near its opening price, it signals market uncertainty about the asset's true value.
The traditional doji candle, which represents the hesitant market, has two wicks of about equal length and a very narrow body (Pic. 2). Additionally, there are other doji varieties that indicate a trend reversal or exhaustion.

- Hammer
The hammer candlestick consists of a wick two times greater than the length of the candle’s body and looks something like, well, a hammer (Pic. 3). Bulls, in particular, pay close attention to hammers because those candles often herald a possible change in a downtrend.

A hammer happens when the price falls below the open and then rises to close above the open for the day. A bullish candlestick close indicates that even though sellers briefly grabbed control of the market during the trading session, they soon gave way to the bulls. Conversely, if the close falls below the open, shorting investors have prevailed.
- Shooting star
The shooting star is the antithesis of the hammer. It happens when bulls start out strong and lead the trading session but then lose control to bears, who push prices down to a close below the open (Pic. 4). When the low and close are the same, it means the shooting star is bearish.

👉 It's vital to remember that a longer-lasting candlestick has a greater impact on the overall trend.
For example, if you spot a hammer forming in an hourly candlestick, it won't do much to reverse a six-month downtrend, but if it forms on a weekly candlestick, it might have a significant influence.
Cryptocurrency Candlestick Patterns
Price fluctuations are what form the candlestick. These price changes may seem random at first glance, but they often take on discernible patterns that may be used for study and trading. There are plenty of crypto candle patterns, and it’s important to recognize and understand at least a few basic ones.
Unsurprisingly, there are bullish and bearish candlesticks. Bullish candles signal positive market sentiment and rising prices, while bearish represent the opposite. Candlestick patterns, although not perfect, can provide some insight into where prices may be headed next, making them a valuable resource for tech analysts.
- Bullish Engulfing Pattern
The Bullish Engulfing pattern (Pic. 5) happens when buyers start to outnumber sellers. On the graph, this is shown as a long green candle body swallowing up a shorter red body. The price may rise now that bulls have gained control.

- Bearish Engulfing Pattern
The Bearish Engulfing pattern (Pic. 5) forms when, in an upswing, sellers start to outnumber buyers. When that happens, a candlestick’s long red body swallows up a short green one. The price drop may continue since the pattern suggests sellers have taken control.
- Morning Star
The Morning Star (Pic. 6) is an uptrend reversal pattern that consists of three candlesticks, with the central one shaped like a star. If it develops on a solid support, it signals that a downturn may be losing momentum and turning around. The morning star begins with a red candlestick, followed by a star-shaped second candle that has a shorter real body and stands apart from the first. This star is the first indication of bearish weakness, as it occurs when sellers are unable to push the price significantly lower than the previous period's close. The third candlestick confirms this by turning green and closing at least 50% higher than the first candlestick's body.

- Evening Star
The bearish Evening Star (Pic. 6) signals a possible reversal of the upward trend. Being the polar opposite of the Morning Star, it too has three candlesticks with a star in its center. The Evening Star's first candlestick is green with a sizable real body. The second is the star with a very narrow base and no contact with the real body of the previous candle. However, it can also develop within the first candlestick's upper shadow. The formation of such a star is the first sign of weakness in the upward trend, as buyers failed to drive the price higher than the closing of the previous session. The next candlestick in a row validates this weakness by turning red and closing at least 50% above the first candlestick's body.
- Bullish Harami
A Bullish Harami (Pic. 7) happens when a candlestick’s small green real body appears within the previous day's huge real red body. This pattern indicates that the downward trend has paused. Finally, if this greenish candle is followed by another day of improvement, it may signal a trend reversal.

- Bearish Harami
The Bearish Harami (Pic. 7) is the inverse of the Bullish Harami. While the emerging pattern may not be an immediate call to action, it is worth keeping an eye on. The Bearish Harami suggests indecision on the part of the buyers, and if the price continues its upward trajectory, things might still be looking good. Conversely, if sellers drag the price down, it might be time to sell too.
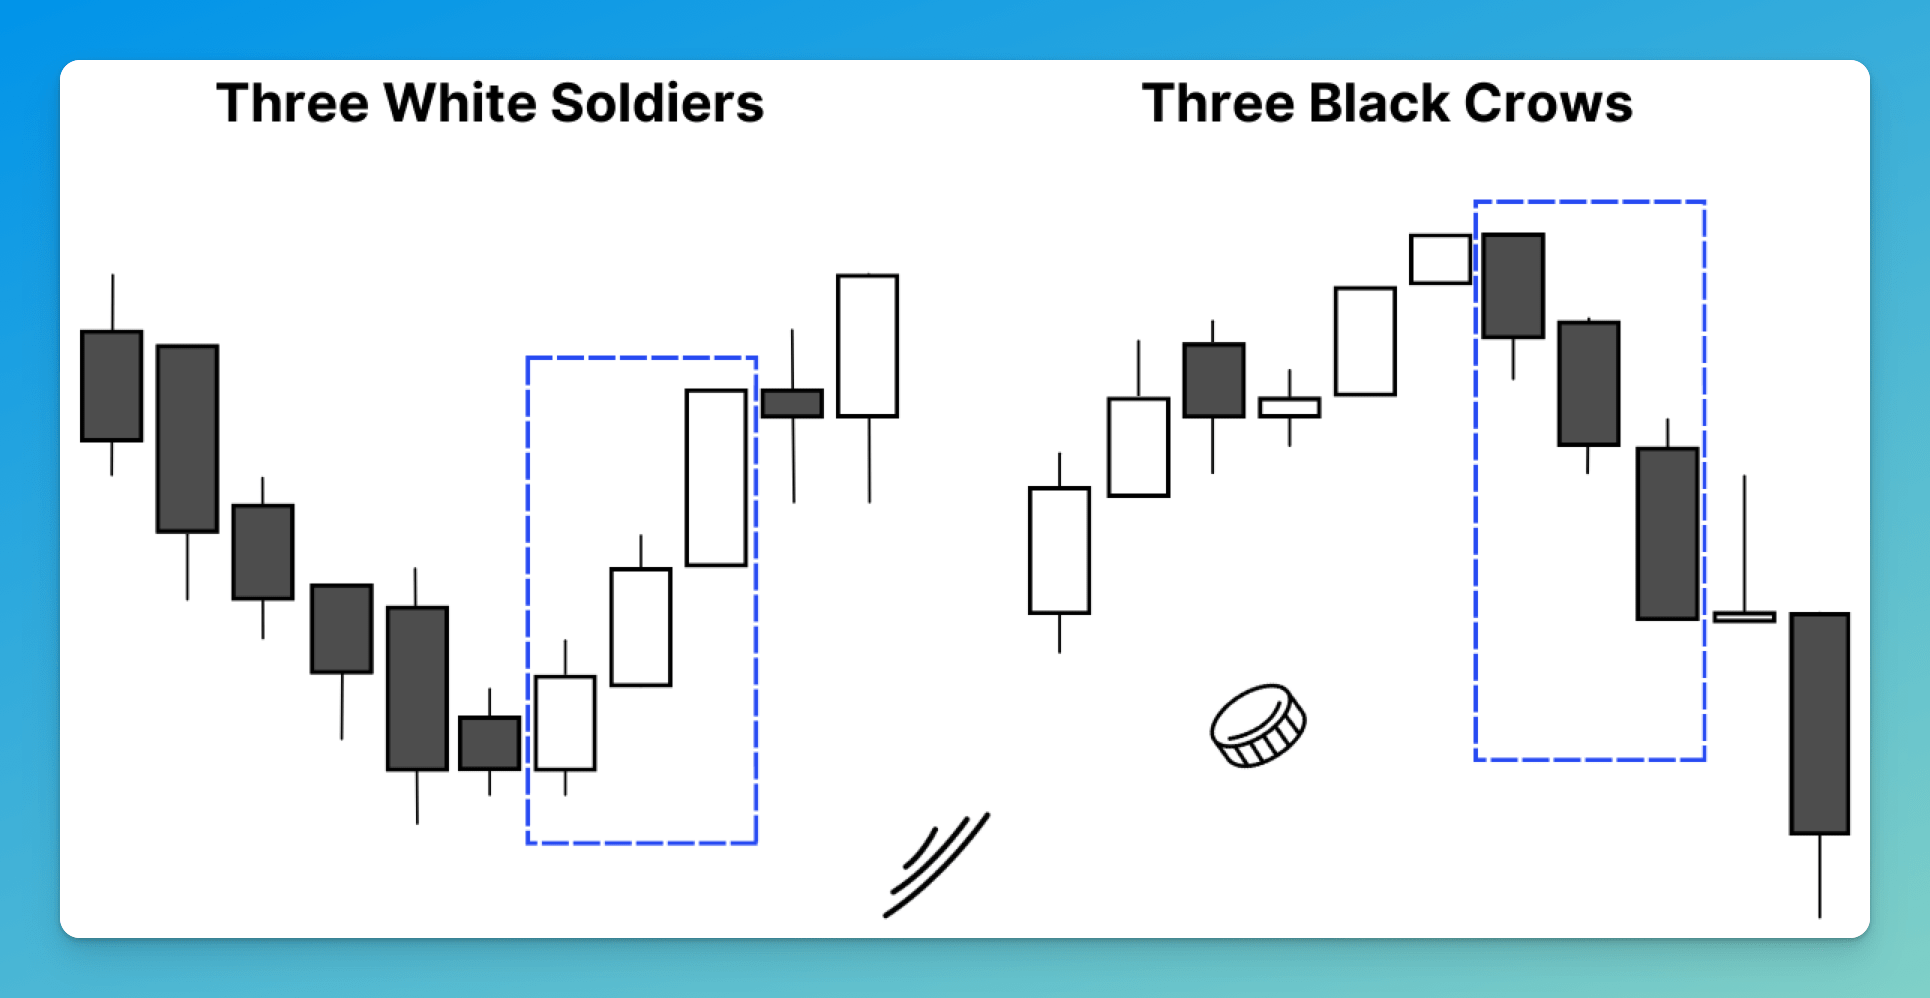
- Three White Soldiers
If three lengthy bullish candles, aka White Soldiers (Pic. 8), follow a downtrend, a reversal might be happening. After a long slump and a brief period of consolidation, this particular triple candlestick pattern is regarded as one of the most powerful, in-your-face bullish signs. The first of the three soldiers is the reversing candle, which signals the conclusion of the decline or the end of the consolidation that followed it. However, the complete pattern emerges only if the body of the second candle is larger than that of the first. In addition, the top wick of the second candlestick should be very short or nonexistent. Finally, the third candlestick should be at least as tall as the second but have little to no shadow.

- Three Black Crows
Compared to the Three White Soldiers candlestick pattern, the Three Black Crows is the opposite. After a sustained uptrend, three bearish candles signal a reverse. The second candle’s body should be larger than the first and close at or very near its low. Finally, the third candle's body should be the same size as, or slightly bigger than, the second candle's body, with an extremely brief or nonexistent lower shadow.
Bitsgap’s Charting Instruments & Tech Analysis Tools
Bitsgap has plenty of advanced charting instruments and widgets that can help you perform in-depth analysis, including a comprehensive study of crypto candlestick patterns and types.
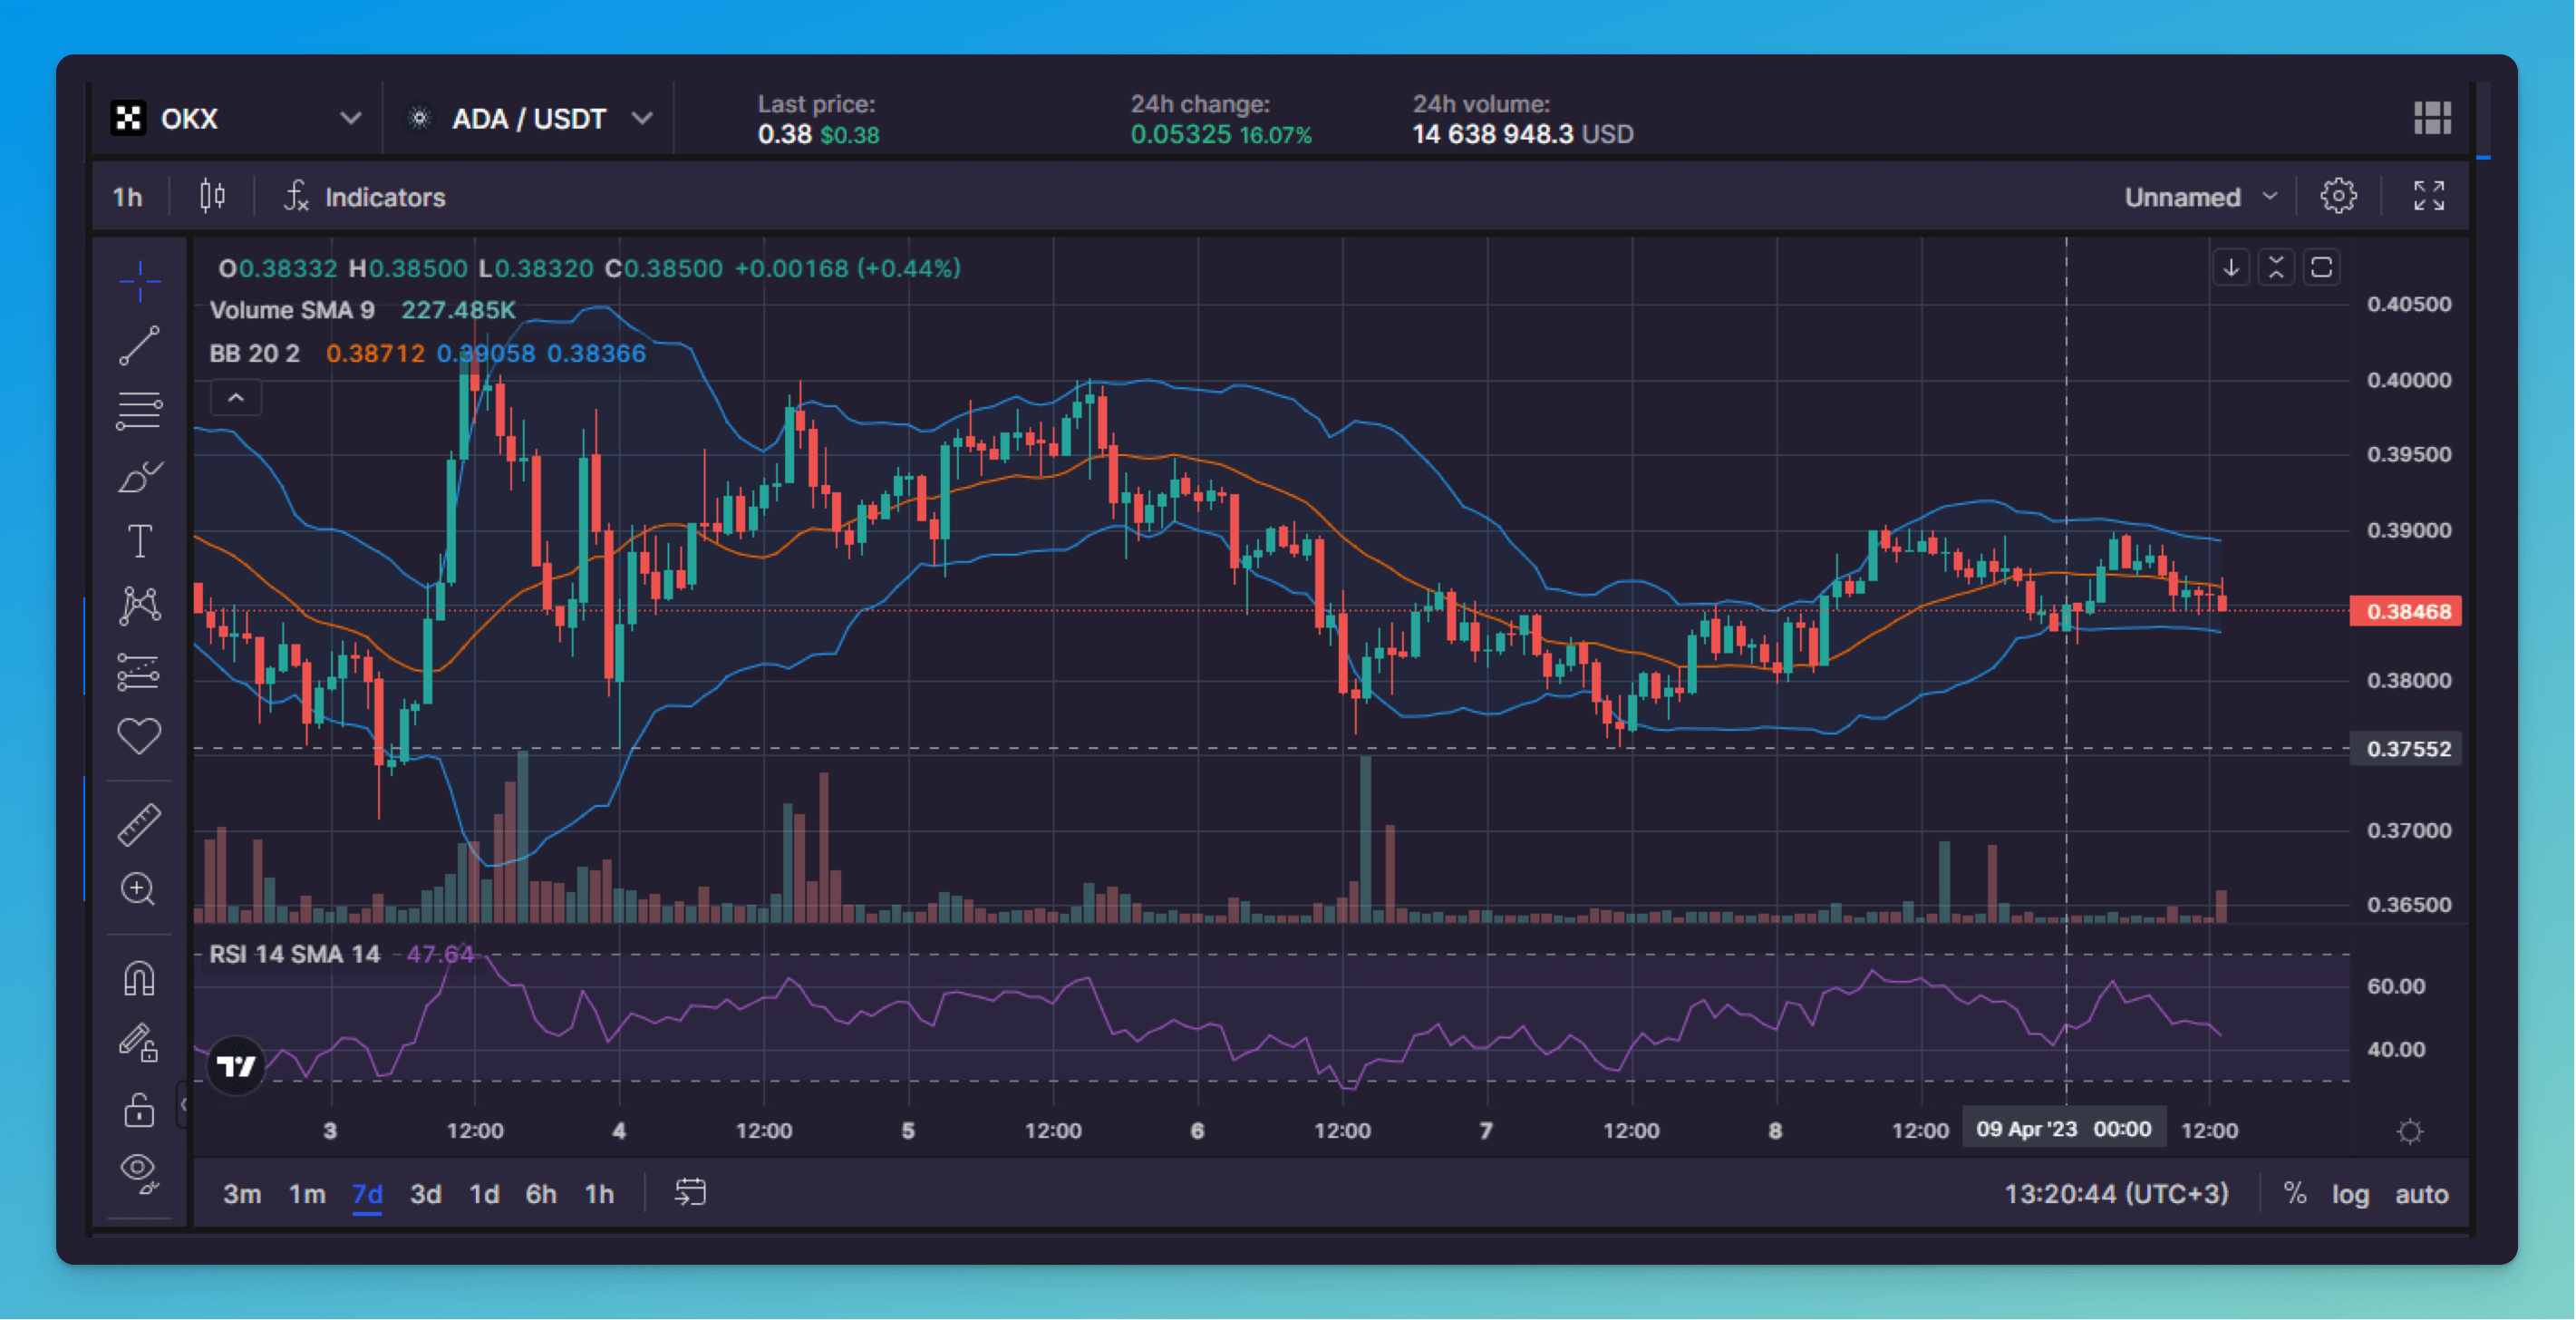
Firstly, there’s a chart with indicators and painting instruments that is available when you click on the [Trading] tab in the terminal (Pic. 9):

While indicators, time frames, and chart types can be chosen on the top of the charting interface, the drawing tools are available on the left-hand side. You may learn about the different charting instruments by checking out our article on Bitsgap’s built-in TradingView interface.
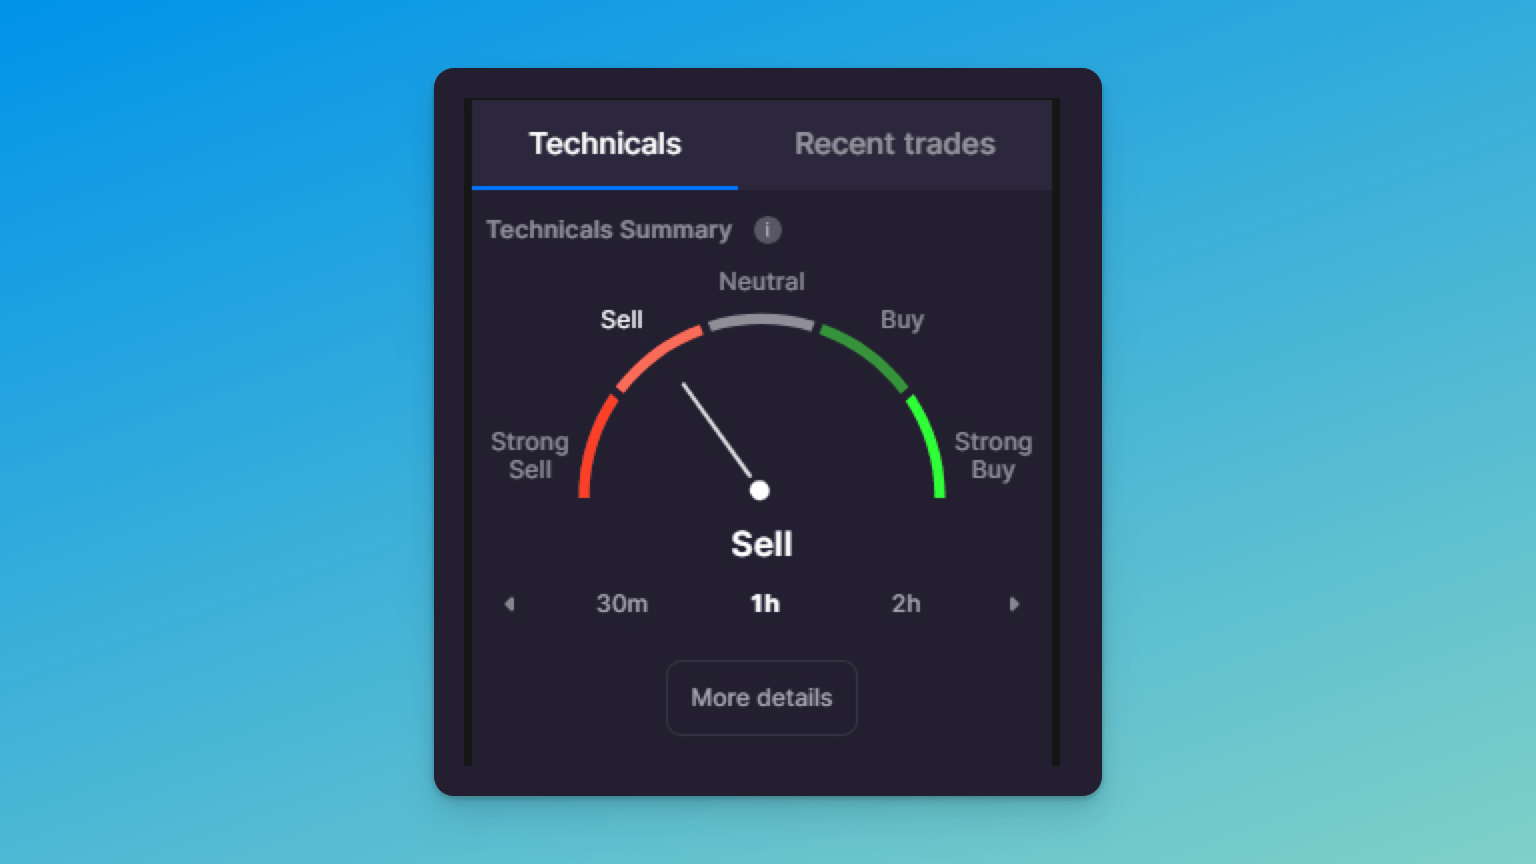
Secondly, Bistgap has a fantastic tool — the Technicals Widget (Pic. 10) — that accurately gauges the market sentiment by analyzing and combining dozens of indicator and oscillator signals. You can find the Technical Widget right under the order book.

Finally, Bitsgap has plenty of automated trading tools, including the DCA trading bot that can trade based on indicator signals. Of course, no one automated tool can substitute for manual trading research, but it certainly helps! Couple your own research with indicator-based trading, and you have all the chances of drastically improving your returns and reducing risks! You’re welcome to try it now!
FAQs
Which Crypto Candlestick Pattern Is Most Reliable?
Of course, there’s nothing like “the most reliable” pattern. All patterns are possible indications rather than guarantees. However, some traders refer to the Bullish Engulfing pattern as one of the most solid candle patterns. And that makes sense because it often signals an imminent price increase. They are also one of the simplest candlestick patterns to recognize, making them a favorite among crypto traders with little experience.
How Do You Practice Trading with Candlesticks?
You probably won’t be good at analyzing crypto candles or trading, in general, the first time around. Trading with real money with little to no experience might result in some very expensive lessons. The best way to learn and prepare yourself for trading crypto is to practice on a demo account first. Thankfully, Bitsgap has paper trading modes for both spot and futures markets, so you have ample opportunities to test and develop strategies before committing your own capital. You may put in as much time as you want, and when you feel confident in your skills, you can go over to trading for real!
What Is a Bitcoin Price Candlestick?
Bitcoin candlestick chart is a special type of price chart that displays bitcoin’s price in the form of candles with either red or green bodies and upper and lower wicks. Such convenient representation helps you gauge the market sentiment and predict bitcoin’s future price movement more accurately. Candlestick timeframes might vary greatly. For example, a particular exchange’s default candle might be set to six hours, but you may change it to be longer or shorter. It's also important to remember that cryptocurrency markets, unlike stock markets, are open 24/7. So, “open” and “close” prices are prices at the beginning and end of your chosen period.
