
Technicals
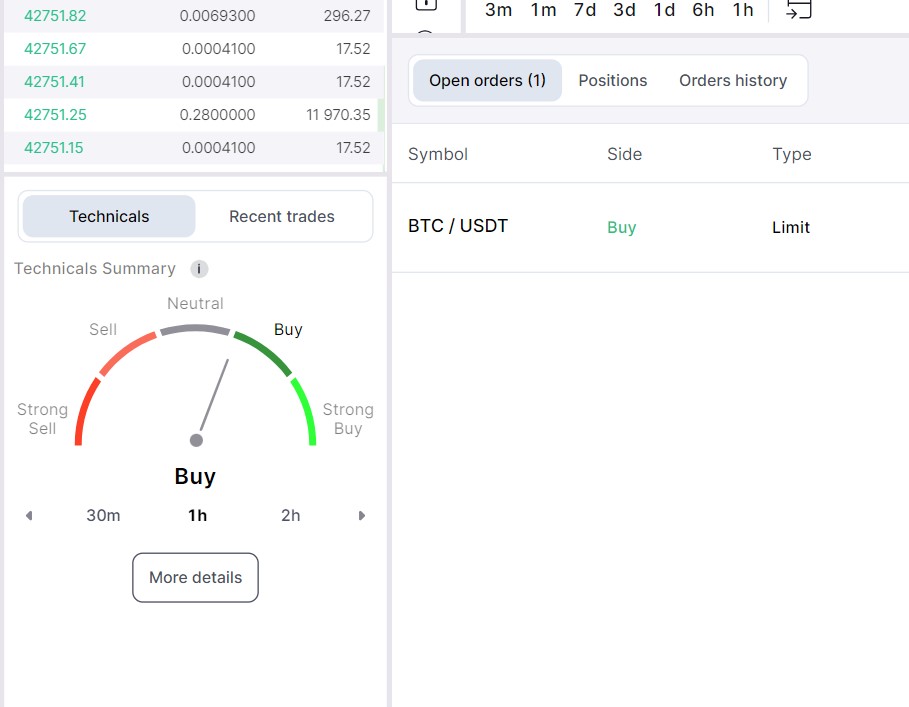
The Technicals is a technical analysis tool that combines signals of several indicators and oscillators. The widget makes it easier for traders to spot potentially favorable conditions for taking a trade.
Many traders utilize a variety of indicators to make better trading decisions. The Technicals tool simplifies this process by combining and averaging the values of the most popular indicators. The gauge shows a real-time technical analysis overview for your chosen timeframe. By selecting various timeframes, you can compare them with each other and monitor the market in your favorite timeframe.
Signals and Indicators
Results are based on the summary of the indicators' values which form Buy, Neutral, and Sell signals for each indicator and are represented by the following statuses:
Strong Buy - the majority of indicators generate Buy signals.
Buy - most indicators generate Buy signals.
Neutral - the number of Buy and Sell signals is approximately the same (50/50).
Sell - most indicators generate Sell signals.
Strong Sell - the majority of indicators generate Sell signals.
Please, find below the values used to determine the rating of the indicators and their signals.
Oscillators
Indicator
Buy signal
Neutral signal
Sell signal
Average Directional Index (14)
Indicator > 20 and +DI line crosses over -DI line
Neither Buy nor Sell
Indicator > 20 and +DI line crosses under -DI line
Awesome Oscillator
Saucer and values are greater than 0 or cross over the zero line
Neither Buy nor Sell
Saucer and values are lower than 0 or cross under the zero line
Bollinger Bands
The price rises above the upper line of the indicator
The price falls below the lower line of the indicator
Bull Bear Power
Uptrend and BearPower < zero, and BearPower is rising
Neither Buy nor Sell
Downtrend and BullPower > zero, and BullPower is falling
Commodity Channel Index (20)
Indicator < -100 and rising
Neither Buy nor Sell
Indicator > 100 and falling
MACD Level (12, 26)
The main and signal lines are greater than 0, while the main is greater than the signal
The main and signal lines are less than 0, while the main is less than the signal
Momentum (10)
Indicator values are rising
Neither Buy nor Sell
Indicator values are falling
Relative Strength Index (14)
Indicator < 30 and rising
Neither Buy nor Sell
Indicator > 70 and falling
Stochastic (14, 3, 3)
Both lines are less than 20
Both lines are more than 80.
Stochastic RSI (3, 3, 14, 14)
Downtrend and K and D lines < 20 and K line crosses over D line
Neither Buy nor Sell
Uptrend and K and D lines > 80 and K line crosses under D line
Ultimate Oscillator (7, 14, 28)
UO > 70
Neither Buy nor Sell
UO < 30
Williams Percent Range (14)
Indicator < lower band and rising
Neither Buy nor Sell
Indicator > upper band and falling
Moving Averages
Indicator
Buy signal
Neutral signal
Sell signal
Exponential Moving Average (10)
MA value < price
MA value = price
MA value > price
Simple Moving Average (10)
^
^
^
Exponential Moving Average (20)
^
^
^
Simple Moving Average (20)
^
^
^
Exponential Moving Average (30)
^
^
^
Simple Moving Average (30)
^
^
^
Exponential Moving Average (50)
^
^
^
Simple Moving Average (50)
^
^
^
Exponential Moving Average (100)
^
^
^
Simple Moving Average (100)
^
^
^
Exponential Moving Average (200)
^
^
^
Simple Moving Average (200)
^
^
^
Hull Moving Average (9)
^
^
^
Ichimoku Cloud (9, 26, 52, 26)
Base line < price and conversion line crosses price from below and lead line 1 > price and lead line 1 > lead line 2
Neither Buy nor Sell
Base line > price and conversion line crosses price from above and lead line 1 < price and lead line 1 < lead line 2
Volume Weighted Moving Average (20)
MA value < volume
MA value = volume
MA value > volume
Summary
The numerical value of the Sell rating is -1, Neutral is 0, and Buy is 1.
Indicator
Value
Summary Signal
[-1.0 ≥ value < -0.5] — Strong Sell;
[-0.5 ≥ value < -0.1] — Sell;
[-0.1 ≥ value ≤ 0.1] — Neutral;
[0.1 > value ≤ 0.5] — Buy;
[0.5 > value ≤ 1.0] — Strong Buy.
Attention
This information is not an investment recommendation or advice. Do not forget that before you make any trading decision, it might be necessary to conduct an independent technical analysis.
What's Next?
- Introduction to Manual Trading: Learn the essentials of manual trading on Bitsgap and discover how to take full control of your trading strategy.
- Learn About the Price Protection Feature: Explore how Bitsgap's Price Protection feature helps safeguard your trades from unfavorable market movements.
Need Assistance?
If you encounter any issues or have questions, don’t hesitate to contact the Bitsgap Customer Support Team.