DYOR with the Best Tools from TradingView & Bitsgap
Bitsgap + TradingView is a match made in heaven. Learn about a wide variety of tools that can help you do your market research before trading.
Used and admired by 50M+ traders around the world, TradingView is by far the best charting platform to do investment research and spot opportunities across global markets. By subscribing to Bitsgap, you’ll get access to the best TradingView instruments, plus Bitsgap’s smart trading and advanced automation tools.
Few can deny that investment research is important. If you want to have a shot at making consistent profits, there's no way around the drudgery of conducting real research. The majority of traders (including pros) cut corners by taking the research of a few investors that actually do their homework. However, you can’t expect a free lunch forever! Even more so when you discover that some of the freebies are biased, contradictory, or just plain wrong.
To maintain a sustainable flow of profits and a competitive advantage over other investors, you must be ready to do your own research! Fortunately, there are plenty of tools that can help you on this arduous journey. There are news blogs and company sites for fundamental analysis, and Bitsgap and TradingView for technicals.
In this piece, we’ll talk about the last bit — a wide array of technical analysis tools that you can find on Bitsgap’s built-in TradingView interface.
What Is TradingView?
TradingView is the best charting platform and social network for investors online. It brings together both professionals and amateurs to network and exchange investment ideas.
The coolest thing about TradingView is that it democratizes investment research by giving average retail investors access to the same kinds of cutting-edge technology, real-time data, and insightful analysis that were previously reserved for the industry's elite.
👉 By using TradingView, you can greatly improve your charting and trading skills while simultaneously expand your understanding of markets, strategies, and methods.
Apart from having a fantastic trader community, TradingView has plenty of other things to get excited about: a news tracker, educational materials, trade suggestions, scripts, live streams, and an affiliate program to boot.
But, of course, at the heart of TradingView are its awesome technical tools:
- Charts,
- Screeners,
- Heatmaps, and
- Economic calendars.
By partnering with TradingView, Bitsgap has brought the charts and cool instruments to you, trader. Rejoice!
Advantages of Bitsgap’s TradingView Interface
Bitsgap’s TradingView interface provides you with all the tools to do an in-depth technical analysis.
Technical analysis, as you well know, is a key component of a successful trading strategy on a number of levels. You can use it to find the best cryptocurrencies to trade, anticipate market movements, and identify entry and exit points for good profits.
The combination of Bitsgap’s smart trading and automation tools with TradingView’s charting instruments is a match made in heaven. You don’t have to go back and forth between the two platforms — you have the best of both worlds within a single interface.
Trading View: Technical Tools and Charting Instruments
Now, let’s take a deeper look into the TradingView interface and Bitsgap’s tools that you can use for the technical part of your investment research.
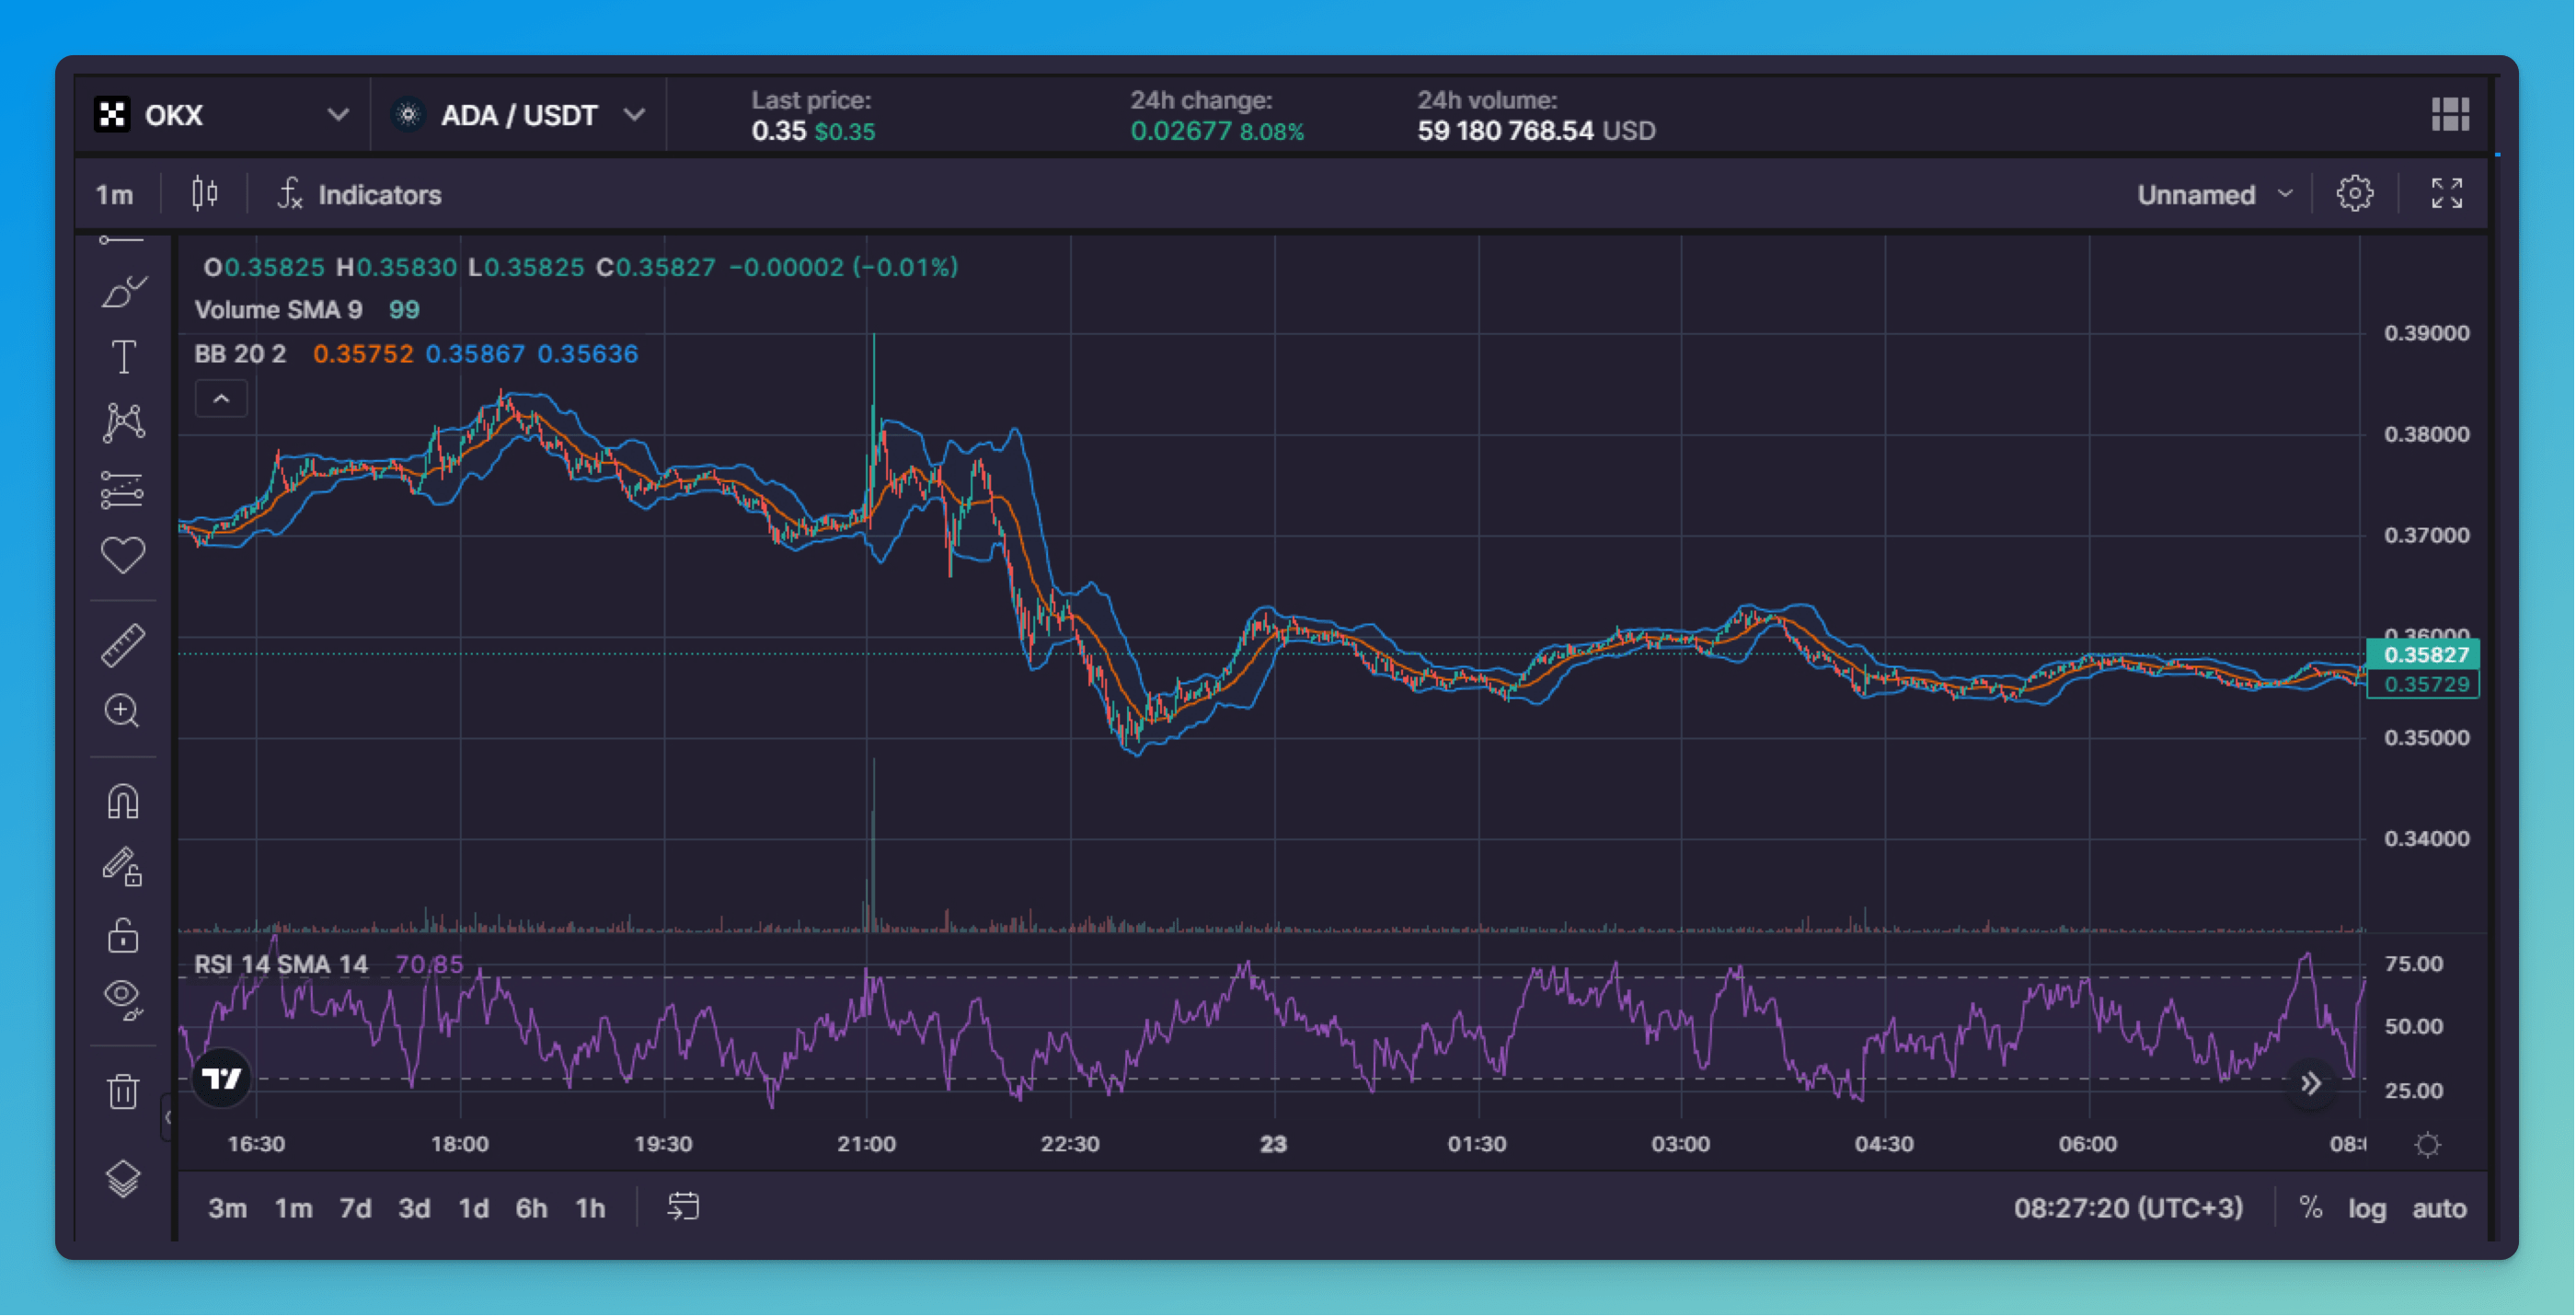
Firstly, it’s a fantastic charting interface. Just go to the terminal, click on the [Trading] tab, and here you go — a splendid chart with multiple indicators and charting instruments (Pic. 1):

You’ll find the chart type and indicators on top of the charting interface and the drawing instruments on its left-hand side.
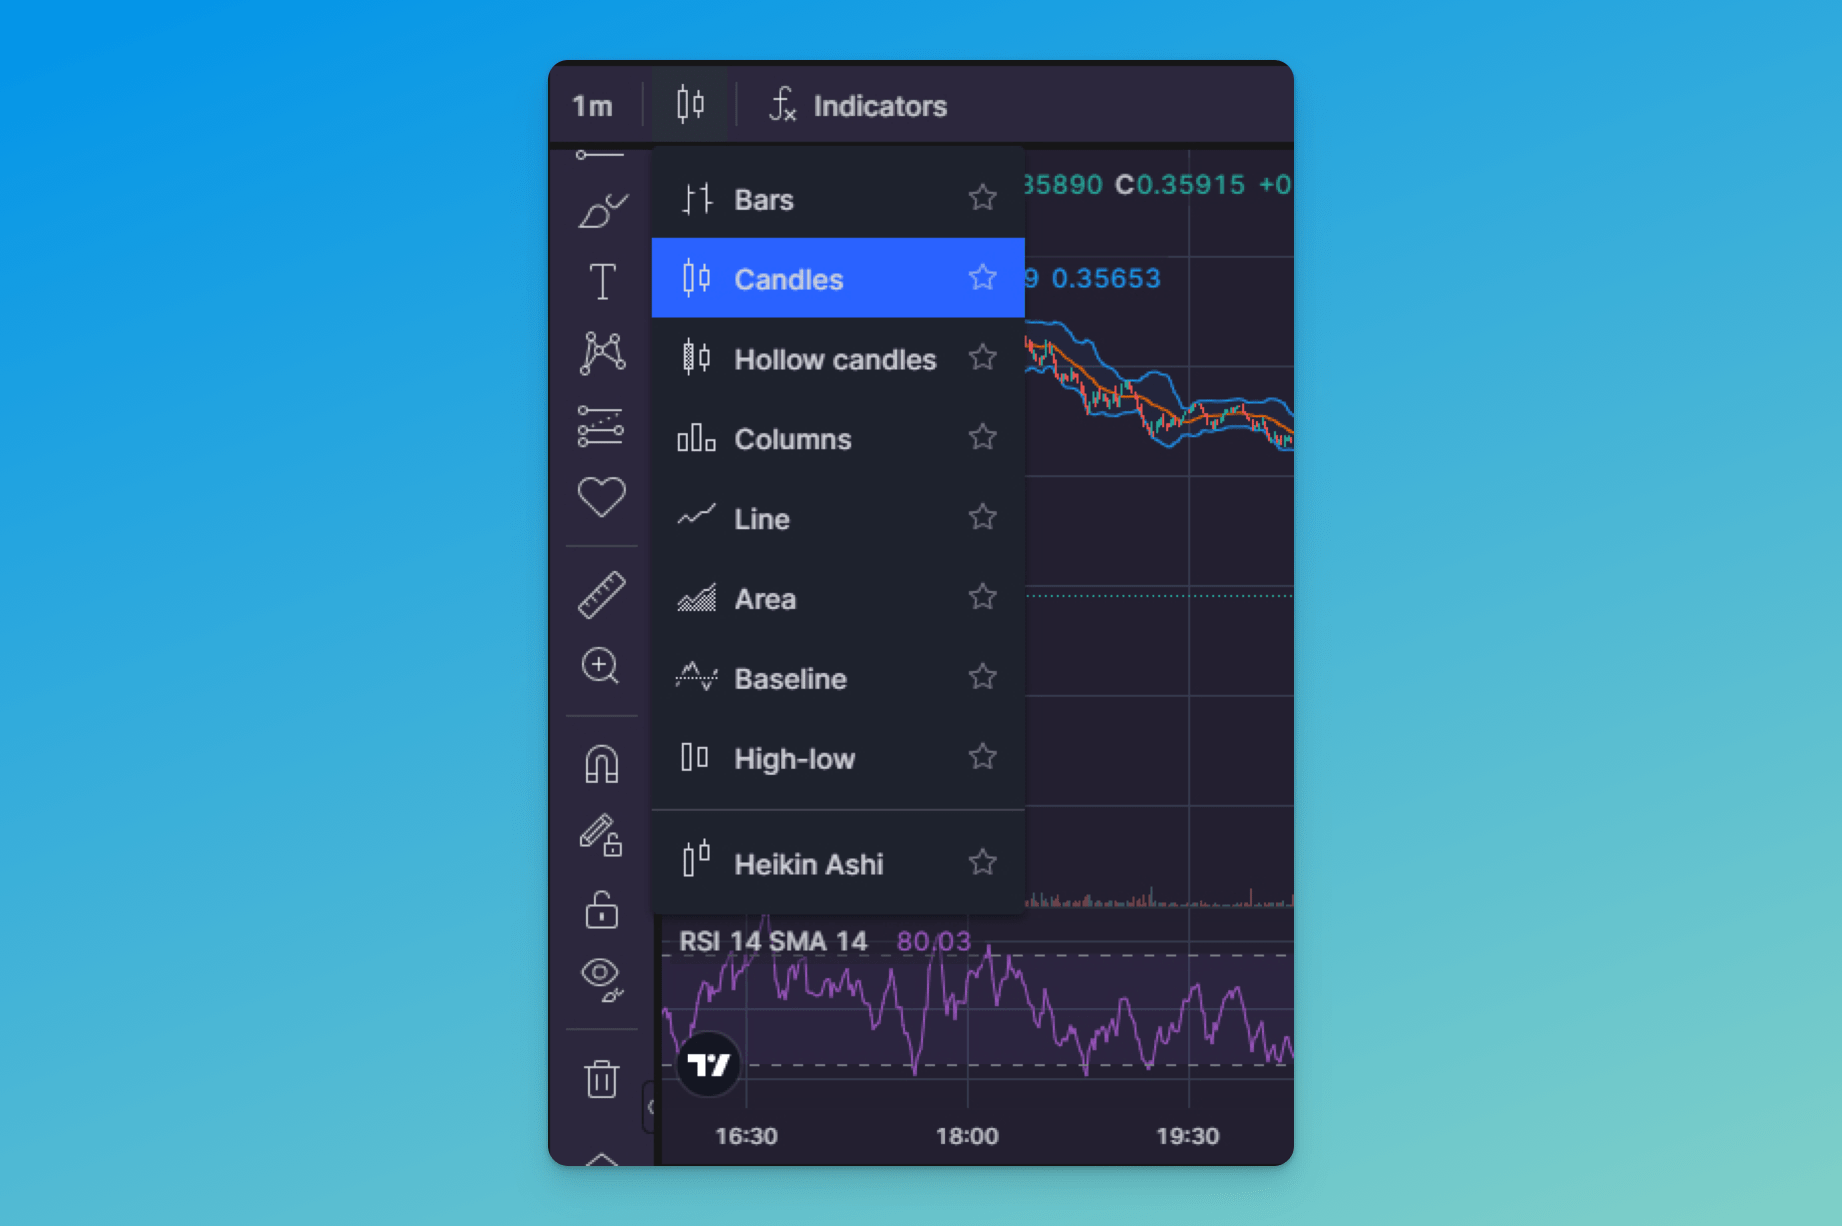
For example, to choose a chart type, click on the [Candles] icon located at the top, between the [Time frame] and [Indicators] icons (Pic. 2):

There are nine different charts available (Pic. 2) — from Bars to Heinkin Ashi — to suit even a seasoned trading pro.
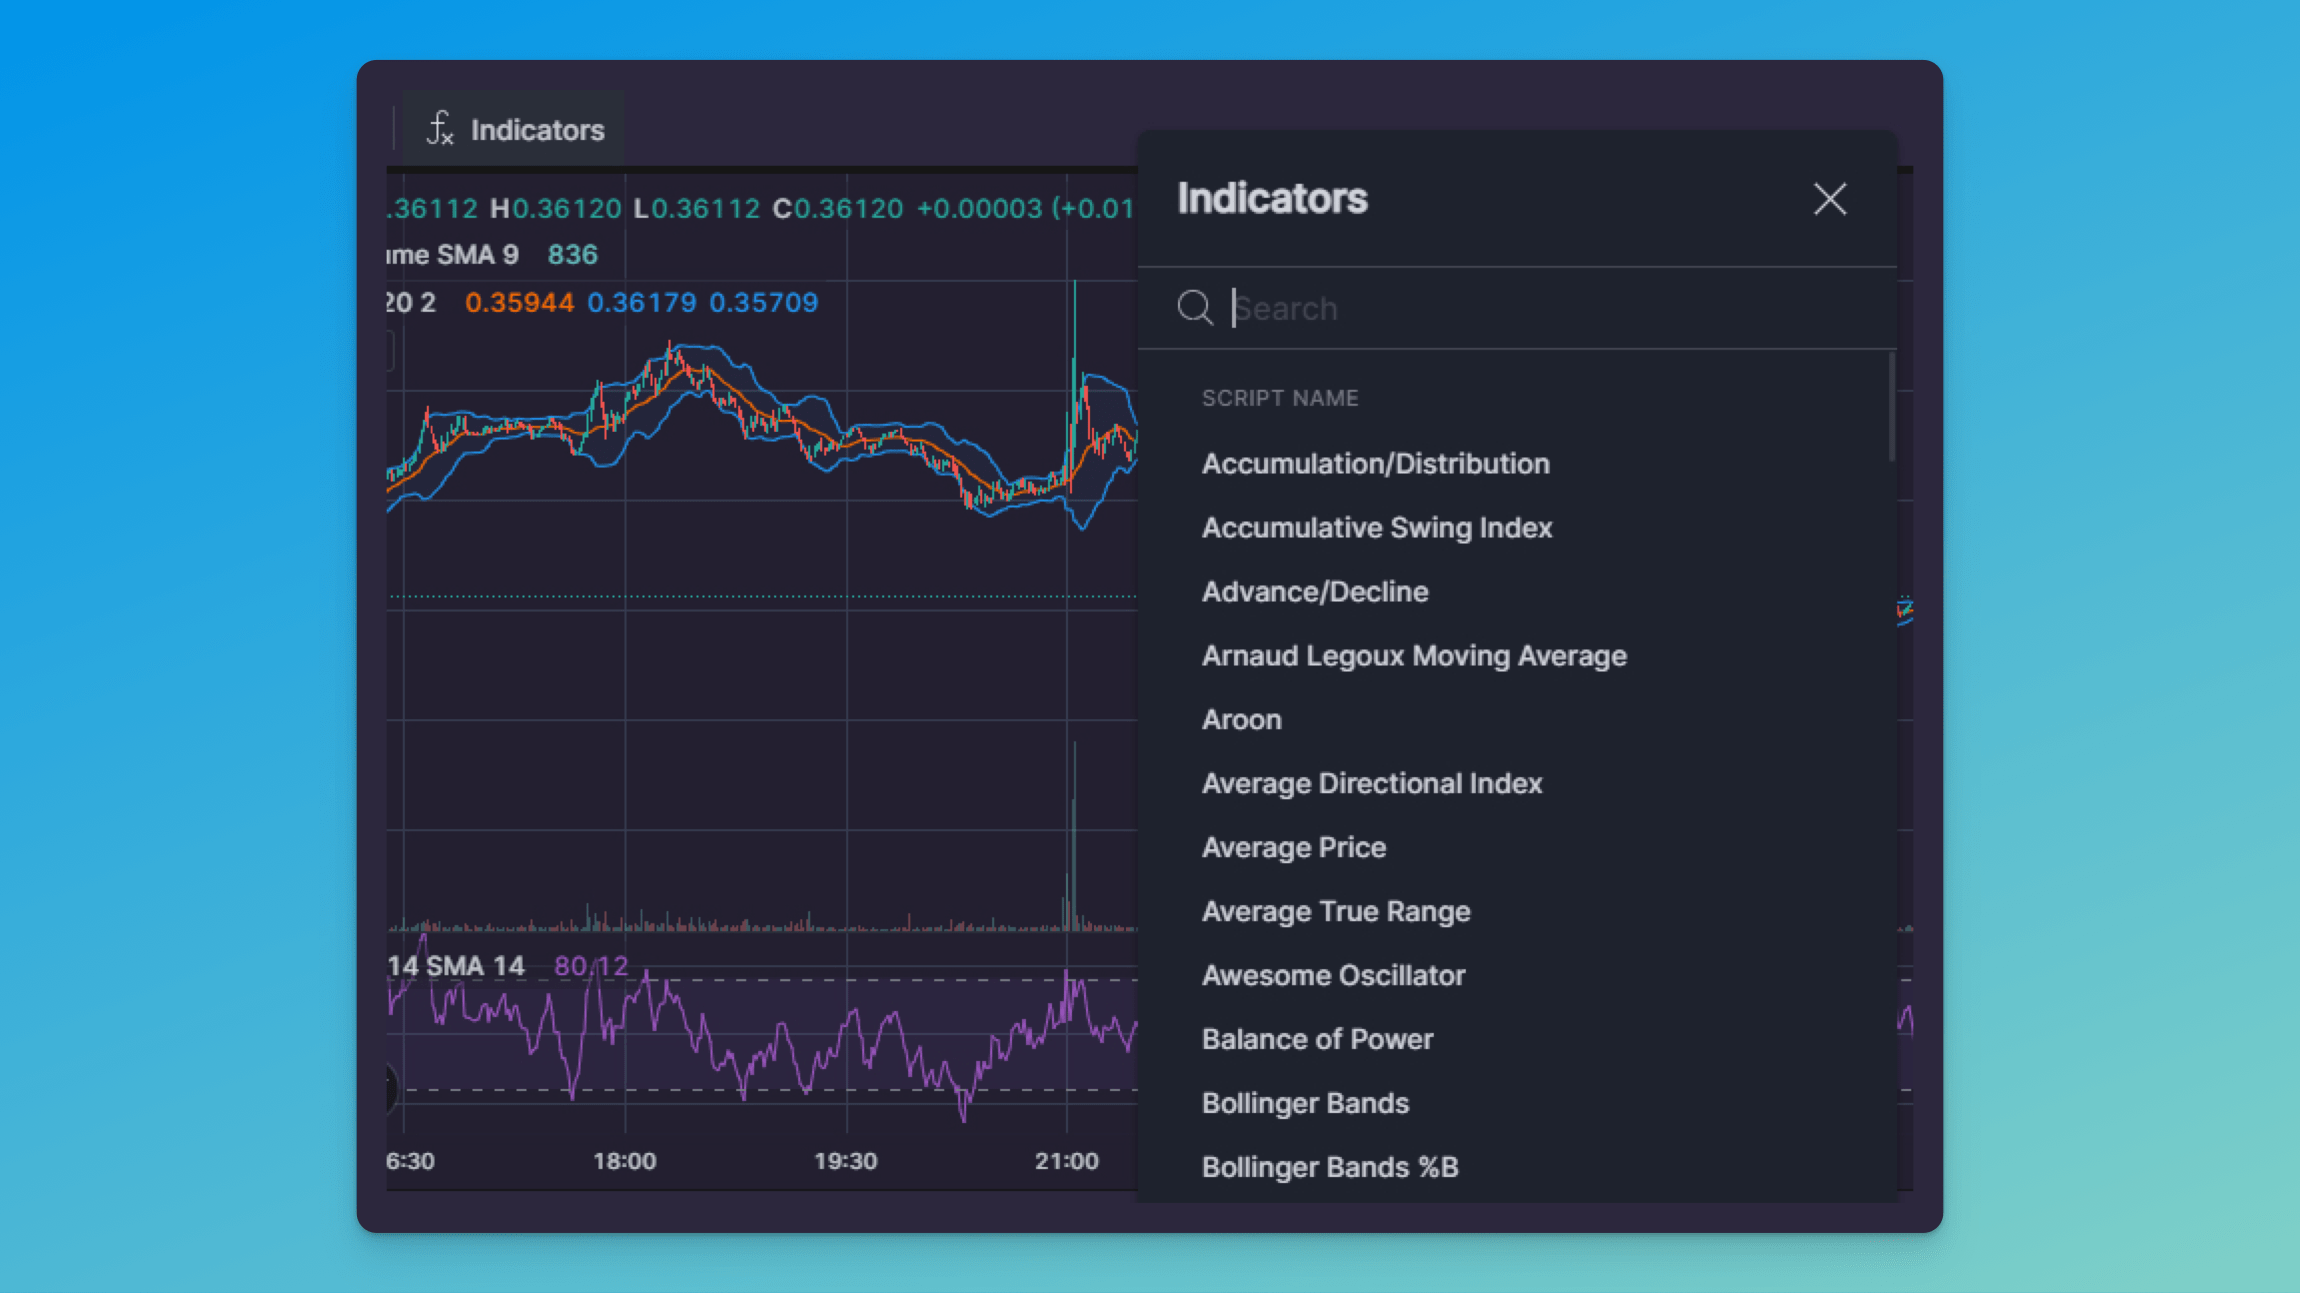
To choose an indicator, click on the [ƒx Indicators] icon and search for your preferred indicator (Pic. 3). If you choose several indicators, they will be displayed one on top of the other at the bottom of the chart or on the chart itself, as is the case with the Bollinger Bands and the RSI on Pic. 1.

Time intervals can be found both at the top and at the bottom of the interface. For example, if you want to look at the six-hour chart, choose [6 hours] from the drop-down menu of the [Time interval] icon (Pic. 4).

If you want to look at a specific time frame, you can use the calendar at the bottom. Click on the [Calendar] icon and choose your desired time frame (Pic. 5):

Should you wish to draw on the chart, click on the drawing instruments located at the right-hand side of the charting screen (Pic. 6):

Go over the drawing tools to see what tools are available. There are trend lines, angles, curves, all sorts of patterns like Elliot Waves or Head and Shoulders, a highlighter, and options for inserting text and emojis.
You can also change the default type of cursor on the chart from the [Cross] to the [Dot] or [Arrow] by clicking on the [Cross] icon on the top of the drawing tools (Pic. 7):

What could be better? Choose the chart type and your favorite indicators, draw trend lines and patterns, paste emojis, and share the results with your friends! Thankfully, the interface is pretty simple and intuitive, so you’ll get used to it in no time.
Bitsgap's Own Additions to the TradingView Tools
For technical aficionados, Bitsgap developed something very special — the Technicals widget, available at the same [Trading] tab, at the bottom of the interface, below the Order book.
👉 The Technicals widget combines signals from dozens of indicators and oscillators. If you know the Fear and Greed index, it looks and works similarly. By combining and averaging signals from the most popular indicators, the widget makes it much easier to find good trade opportunities.
Now, you don’t have to worry about checking each indicator separately; just watch for signals from the Technicals widget or click on [More details] below it to review any particular signal. To learn more about the widget, check out this piece on the blog.
On top of it all, Bitsgap offers other advanced trading tools that most crypto exchanges lack. Think smart orders like Scaled or TWAP and trading bots like GRID, DCA, and COMBO futures. You can check how all of these tools work by perusing Bitsgap’s Help Center at your leisure.
Bottom Line: All Tech Tools for Your Convenience
The TradingView charting tools are easy and intuitive for beginners yet robust enough to satisfy experienced traders. Real-time data and browser-based charting instruments allow you to do your research anywhere and anytime. This is one of Bitsgap and TradingView’s best advantages, considering that crypto markets are extremely time-sensitive. Just open the Bitsgap app in your browser and start charting and trading at the best possible price and opportunity.
Doing your own research is important. Luckily for you, Bitsgap has all the tools you need to do your homework. Ready to roll up your sleeves and dive into it? Here you go!
