
How to Make Better Trading Decisions with the Wyckoff Method
The Wyckoff method helps traders decide what cryptocurrency to buy/sell and when. Learn how to use this method to make better crypto trading decisions.
Who'd have thought that Richard Wyckoff working in the early decades of the 20th century, would set the course of how traders buy and sell assets long into the new millennium? His trailblazing approach, known as the Wyckoff method, still guides modern investors in choosing the best assets and picking the most opportune time to trade.
In this article, we’ll explain the Wyckoff method and how you can use it to make better trading decisions. Let’s get started.
What Is Wyckoff Method?
While working for a New York brokerage firm and observing such trading titans as JP Morgan and Jesse Livermore, Wyckoff decided to codify their best practices into a training methodology to help the public, particularly retail investors, understand how the market operates.
The Wyckoff method came out of those generous efforts to signify a new approach to technical analysis that continues to help traders decide what assets to buy or sell and when to buy or sell them.
👉Although Wyckoff developed his system for a stock market, it works in any freely-traded market, including cryptocurrency.
The Wyckoff method is based on Wyckoff’s theory around price movements in a market lifecycle. So to understand the method, we must first look into the Wyckoff market cycle theory.
What Is the Wyckoff Market Cycle?
The Wyckoff market cycle is based on Wyckoff’s observations of supply and demand and the cyclical nature of price movements.
Wyckoff’s theory outlines key elements in the development of price trends that are marked by four main phases that comprise the cycle: accumulation, markup, distribution, and markdown (Pic. 1). Those phases essentially represent the behavior of traders that often signals the change of direction in asset prices.
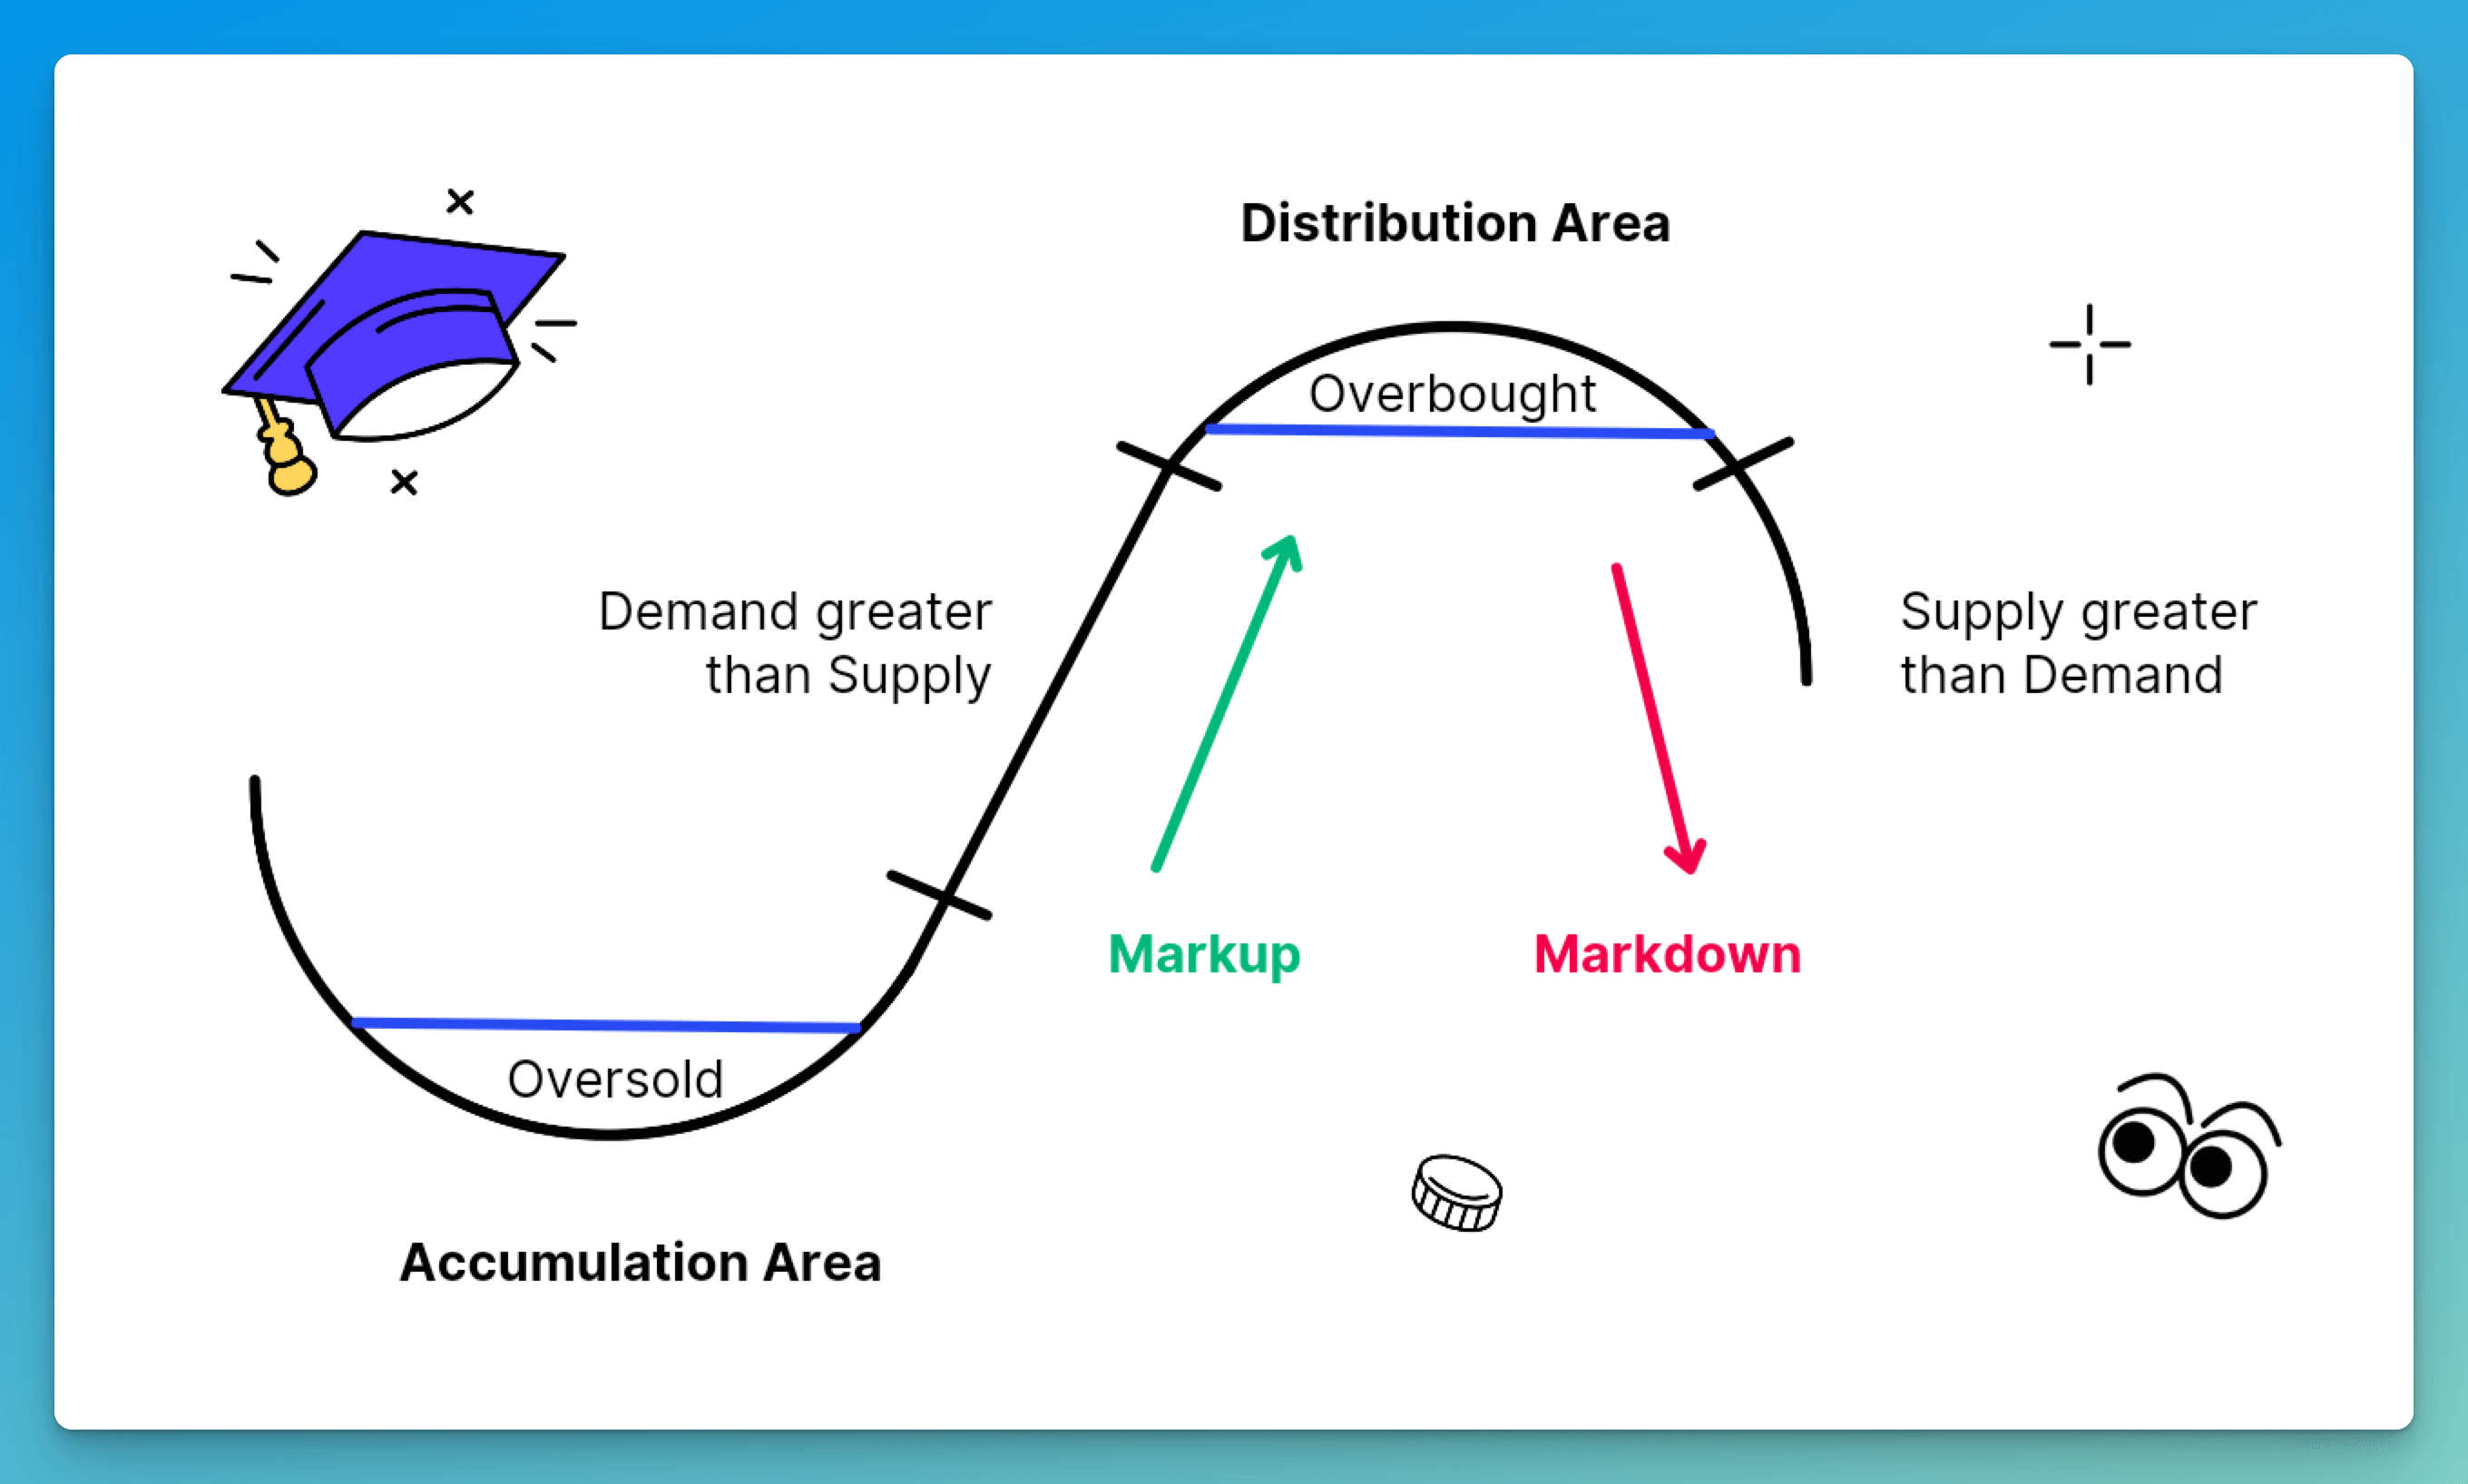
Despite looking deceptively simple, the Wyckoff market cycle schematic (Pic. 1) represents an incredibly important phenomenon — a market’s cyclical nature driven by large interests’ preparation for bull and bear markets. For those ‘large interests,’ Wyckoff came up with a very apt name — the ‘Composite Man.’
👉 Think of the Composite Man as the body of large institutional investors and other big market players who make many transactions with a large number of assets.
Wyckoff knew that it was possible to win the market game by analyzing and anticipating the Composite Man's actions. Thankfully, those actions are reasonably predictable if we pay attention to the market lifecycle, which, as mentioned earlier, comprises four key phases.
Let’s discuss each in detail in the context of cryptocurrency.
What Is Wyckoff Accumulation Pattern?
The market cycle begins with an accumulation phase where institutional investors drive demand by buying up crypto. Accumulation starts after the markdown phase or a bear market. The Composite Man doesn’t typically participate in markdown unless they are shorting but waits until crypto reaches the level where they are willing to start buying it.
An accumulation pattern (Pic. 2) represents a sideways market activity where crypto trades in a wide-bounding range. Although at first sight, it might seem that prices seemingly go nowhere within the phase, they represent an important intelligent activity with the Composite Man accumulating large quantities of crypto. As more interest develops, a trading range will have higher lows.
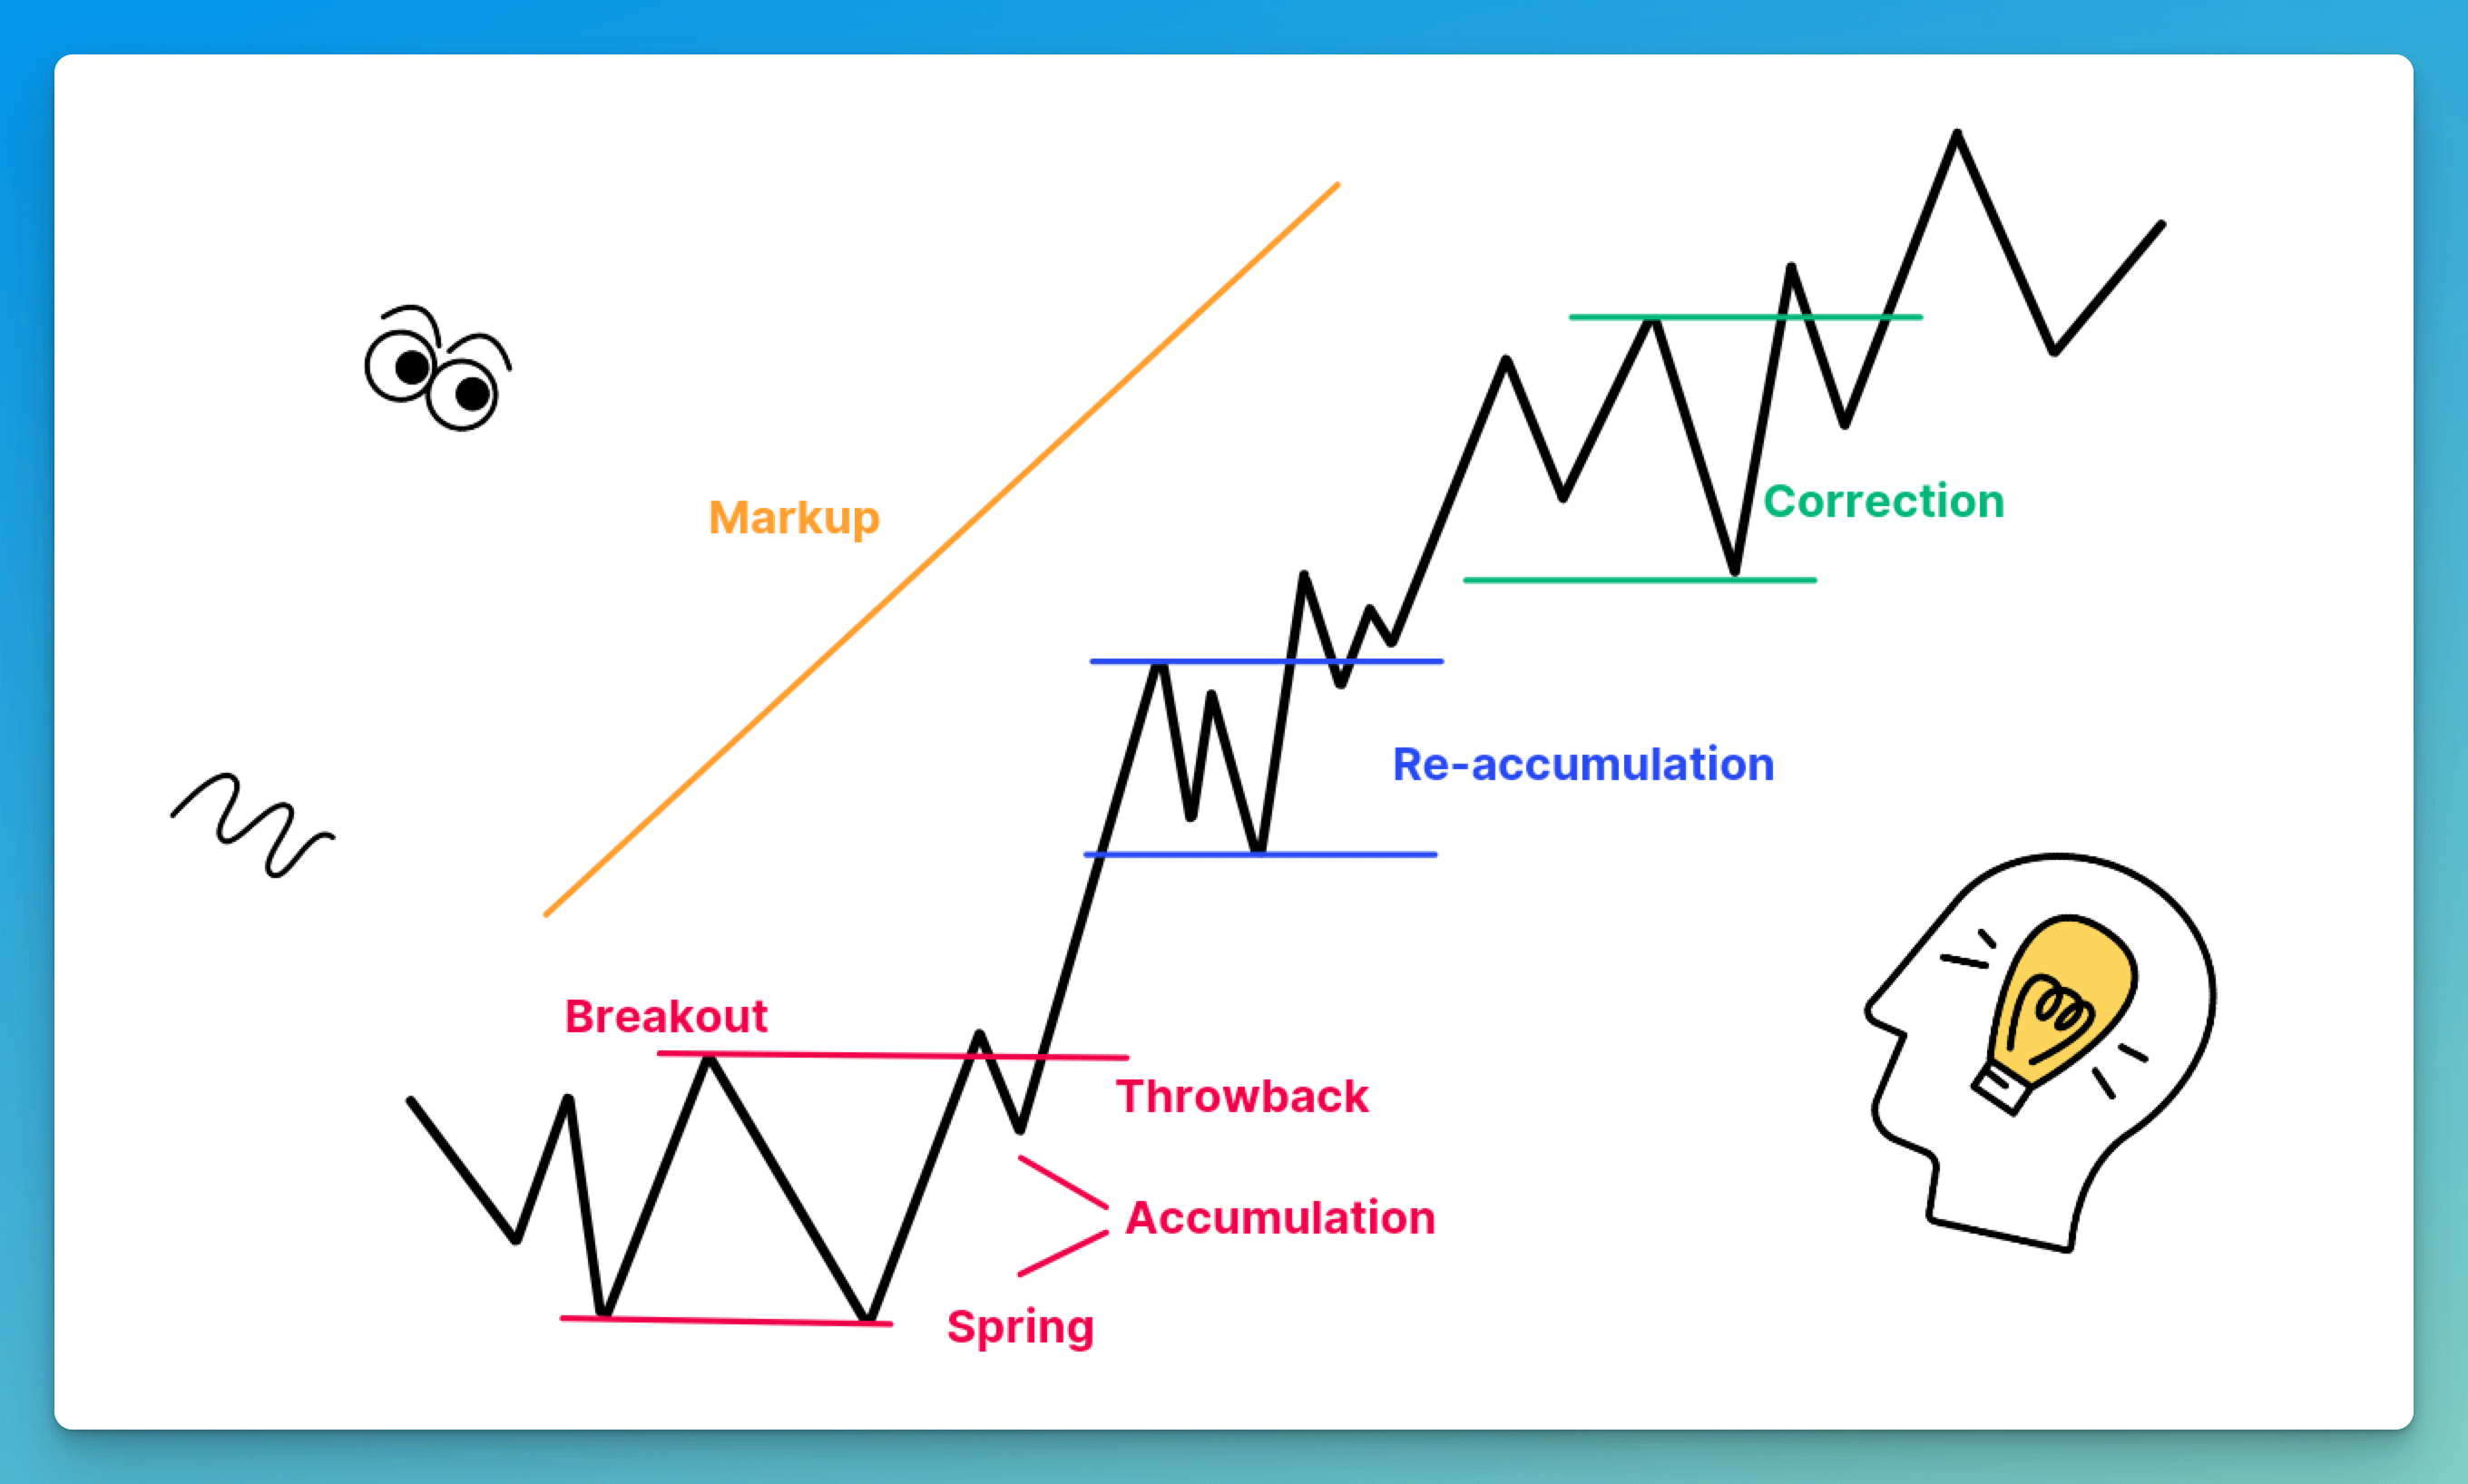
The accumulation pattern will also display opposite activity, like selling climaxes, springs, and sell-offs that eventually recover, move above support, and rally, breaking the trading range and moving prices higher.
What Is Wyckoff Markup?
The markup phase follows accumulation and represents the slope of a new uptrend. Markup is often riddled with throwbacks or buying-the-dip opportunities, which allow investors to catch up with the rally. There might be smaller consolidation patterns, aka re-accumulation phases, and steeper pullbacks called corrections, but all are typically short-term.
What Is Wyckoff Distribution Pattern?
The failure of corrective markup phases to generate new highs signals a new phase called distribution.
Distribution marks the completion of the Composite Man’s campaign — from the buy zone to the sell zone, which can take months and years to unfold.
👉 If large interests have been carefully accumulating and holding crypto during previous phases in distribution, they are just as carefully, thoroughly, and patiently selling crypto until they are completely out.
Even though both distribution and accumulation might look similar (after all, they represent a horizontal trading range), there’s a difference in how the price activity and volatility unfold (Pic. 3).
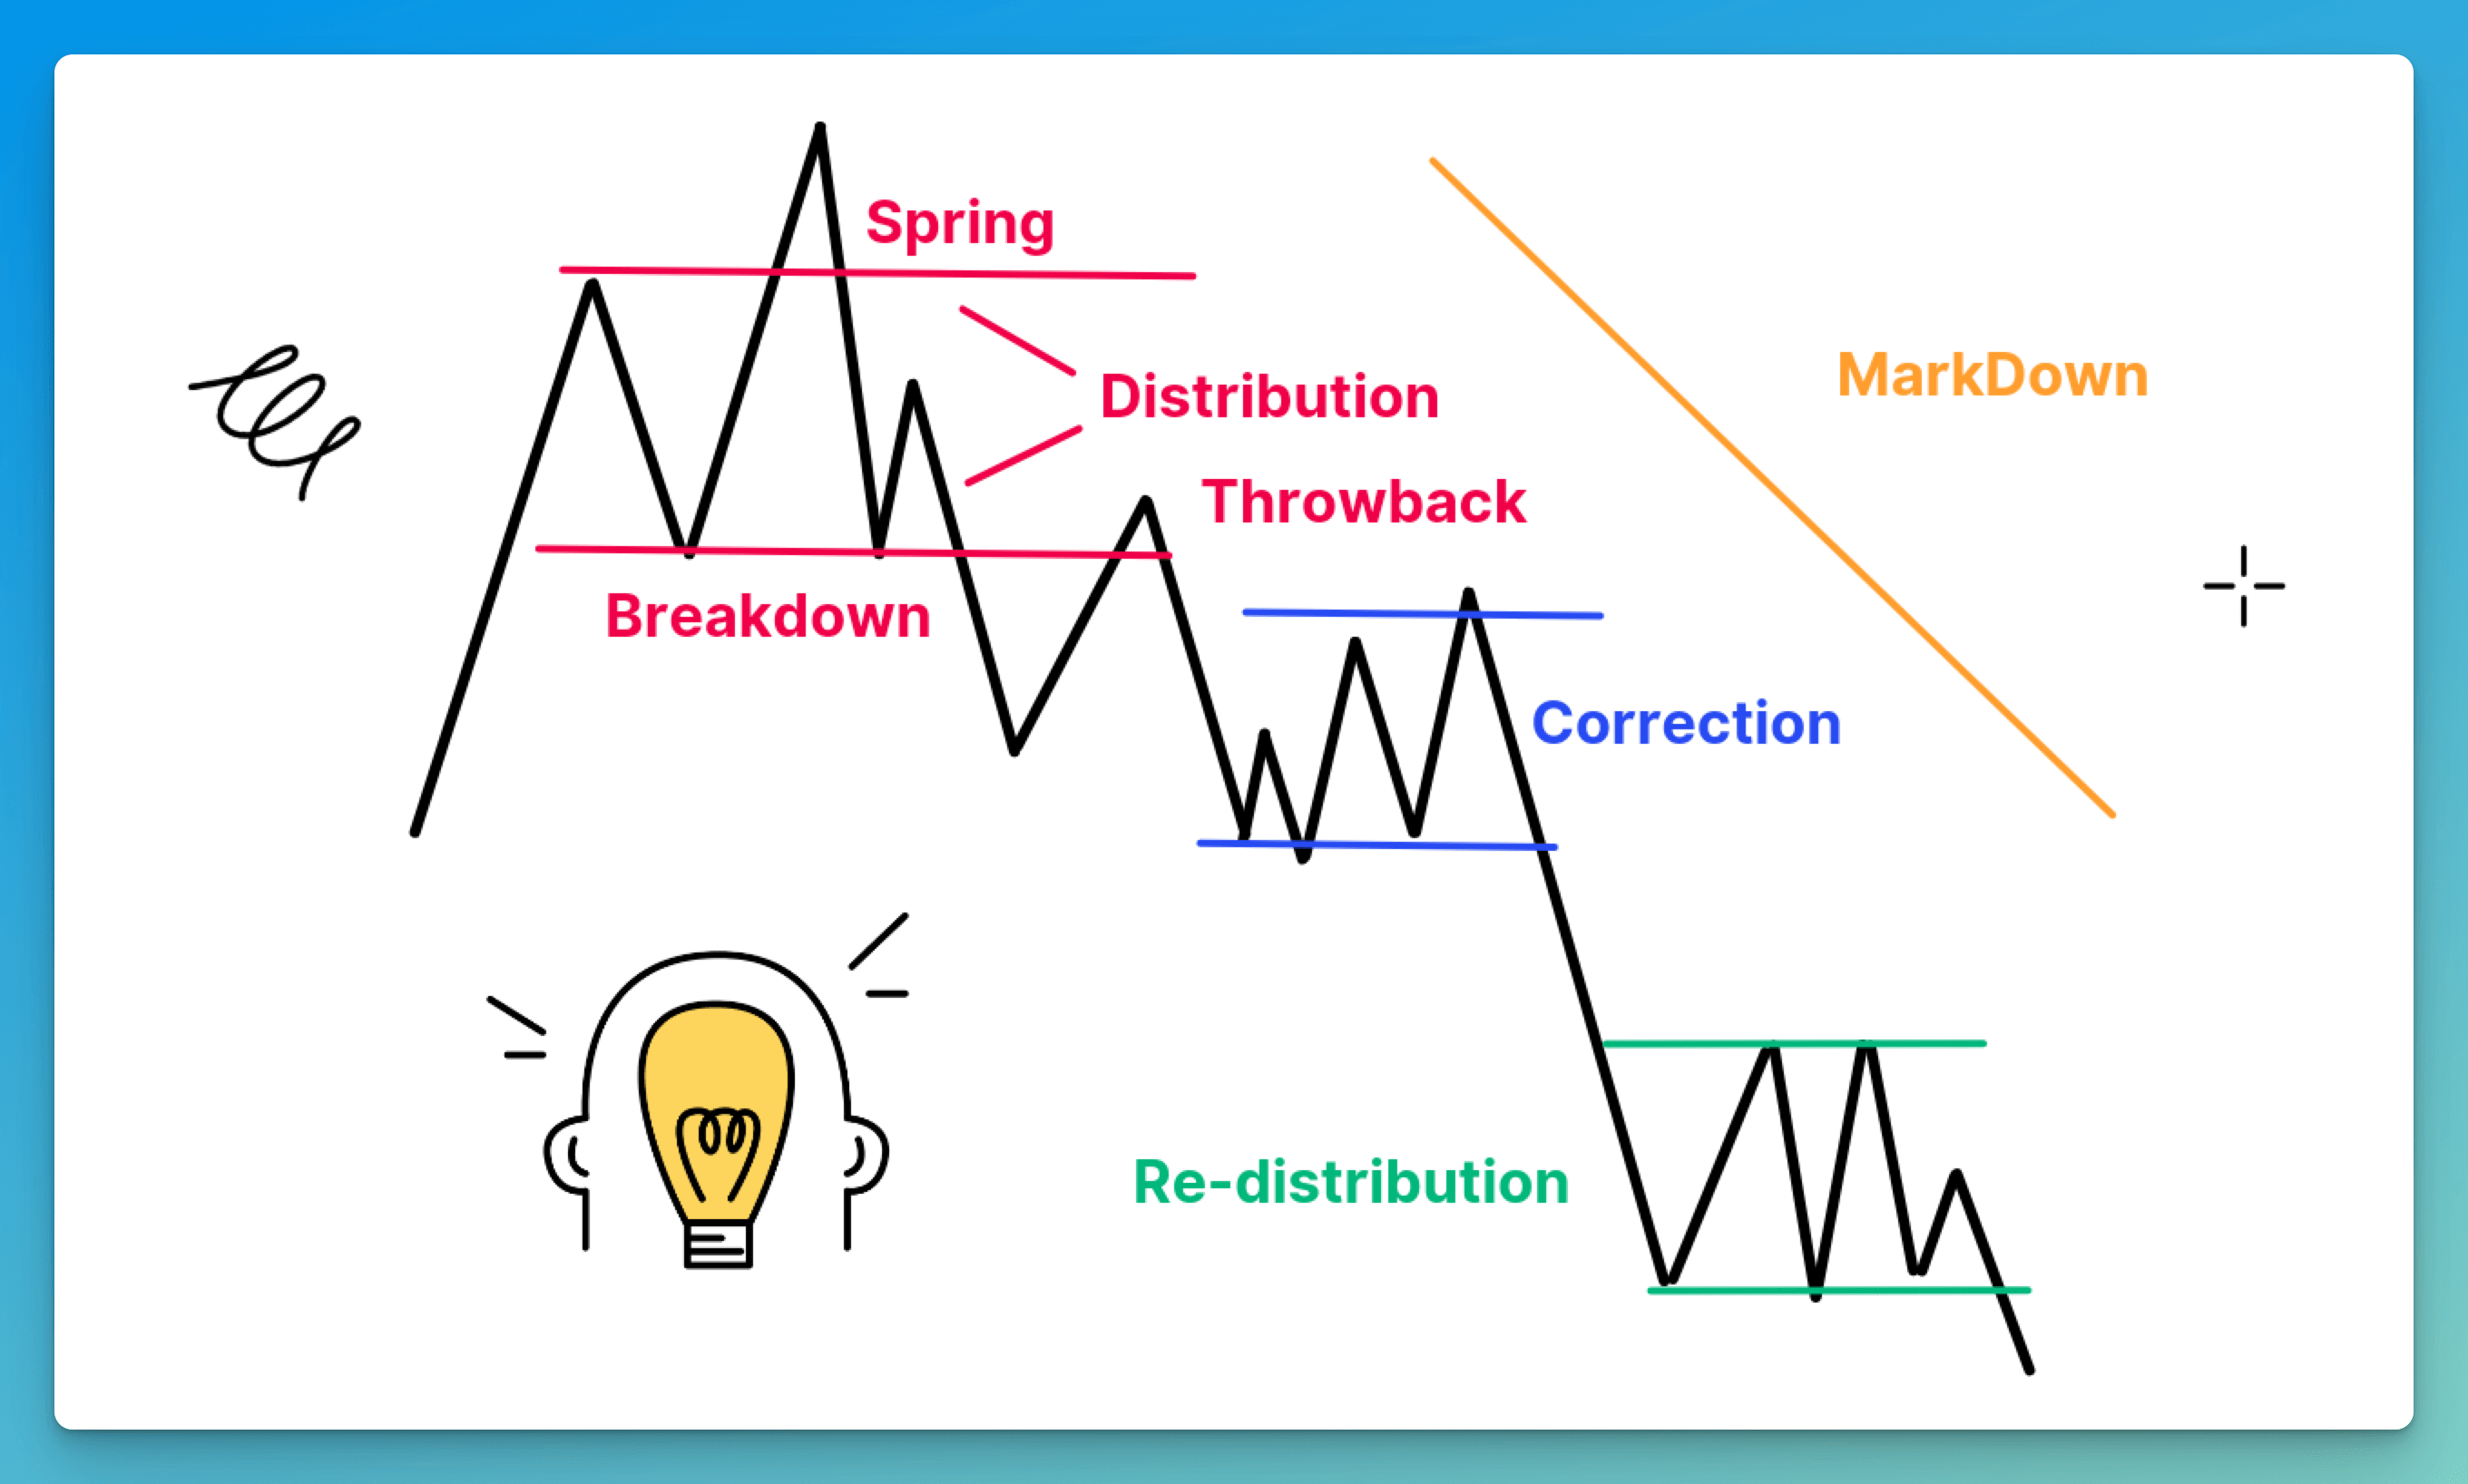
The phase will often display lower price tops and a lack of higher bottoms, and is generally marked by smart money taking profits and crypto flowing to weaker hands. Eventually, the price breaks below the established lows, and the market moves to markdown.
What Is Wyckoff Markdown?
The markdown phase represents the slope of a new downtrend, a time for greater selling. Markdown will have its own redistribution segments and bounces with corrective behavior where the selling pauses or investors catch up with the trend. However, the downtrend eventually resumes until rock bottom or until the price reaches the level where large interests are ready to buy it up again. And the cycle continues.
How To Make Better Trading Decisions with the Wyckoff Method
One of the goals of Wyckoff trading is to improve market timing when taking a position. The most promising opportunities typically lie within trading ranges. Trading ranges are areas where the prior upward or downward trend has stopped, and institutional traders are building up or disbursing their positions.
The difference between the accumulation and distribution trading ranges is that in the former, the purchased crypto outnumbers the sold, while in the latter — it’s vice versa. The extent and nature of each phase determine what happens after the price moves out of the trading range.
Wyckoff Principles
When analyzing the trading ranges and subsequent price movements, Wyckoff came up with the following principles, which you can use to make better trading decisions:
- Determine the market’s current trend and potential future direction. Analyze if the market is positioned to move upward or downward based on the existing supply and demand data. This analysis can help you understand if you need to be in the market, and if yes, then what position to take — either long or short.
- Choose crypto that is in line with the trend. In a bull market, focus on coins that show greater percentage increases during upswings and smaller decreases during reactions. In a downtrend, choose crypto that’s weaker than the market.
- Look for crypto in trading ranges as they represent opportunities for buying during the accumulation phase or selling during distribution.
- Determine if crypto is ready to move. Examine the behavior of the overall market, the price, and the volume of the chosen crypto. Does your evidence indicate that supply has been fully absorbed in an apparent accumulation phase? Is crypto more responsive to rallies and more resistant to reactions than the market index? If yes, buy.
- Time your trade to take advantage of the market movement. Buy when your analysis indicates the market will rally and sell if you anticipate the fall. Use hedging mechanisms to protect your trading.
Wyckoff Rules
Along with trading principles, Wyckoff laid out three important rules which revolve around the importance of context in financial markets:
- The market and individual assets never behave in the same way twice. On the contrary, trends appear as a broad range of comparable pricing patterns that show infinite variations in size, intricacy, and extension. Each subsequent iteration changes just enough to confuse market players, a phenomenon known as shape-shifting.
- Price movements should be analyzed within the context of past price behavior. Historical context is the key to understanding existing and forecasting future market movements in financial markets. It’s incorrect to draw conclusions from a price action of a single day if it’s being studied in a vacuum.
- Essentially, there are three types of trends — up, down, and flat — and three types of timeframes — short-term, intermediate, and long-term. Trends vary significantly in different time frames.
Finally, Wyckoff advised using at least three types of charts:
- Bars
- Point-and-Figure (P&F) Chart
- Plot auxiliary lines
Bitsgap’s Technical Analysis Tools
Although Bitsgap doesn’t offer specific indicators that are based on Wyckoff logic, the platform has an incredible array of many other helpful charting instruments and indicators that you can use to perform Wyckoff technical analysis. Let’s go over each in detail below.
Charting Tools
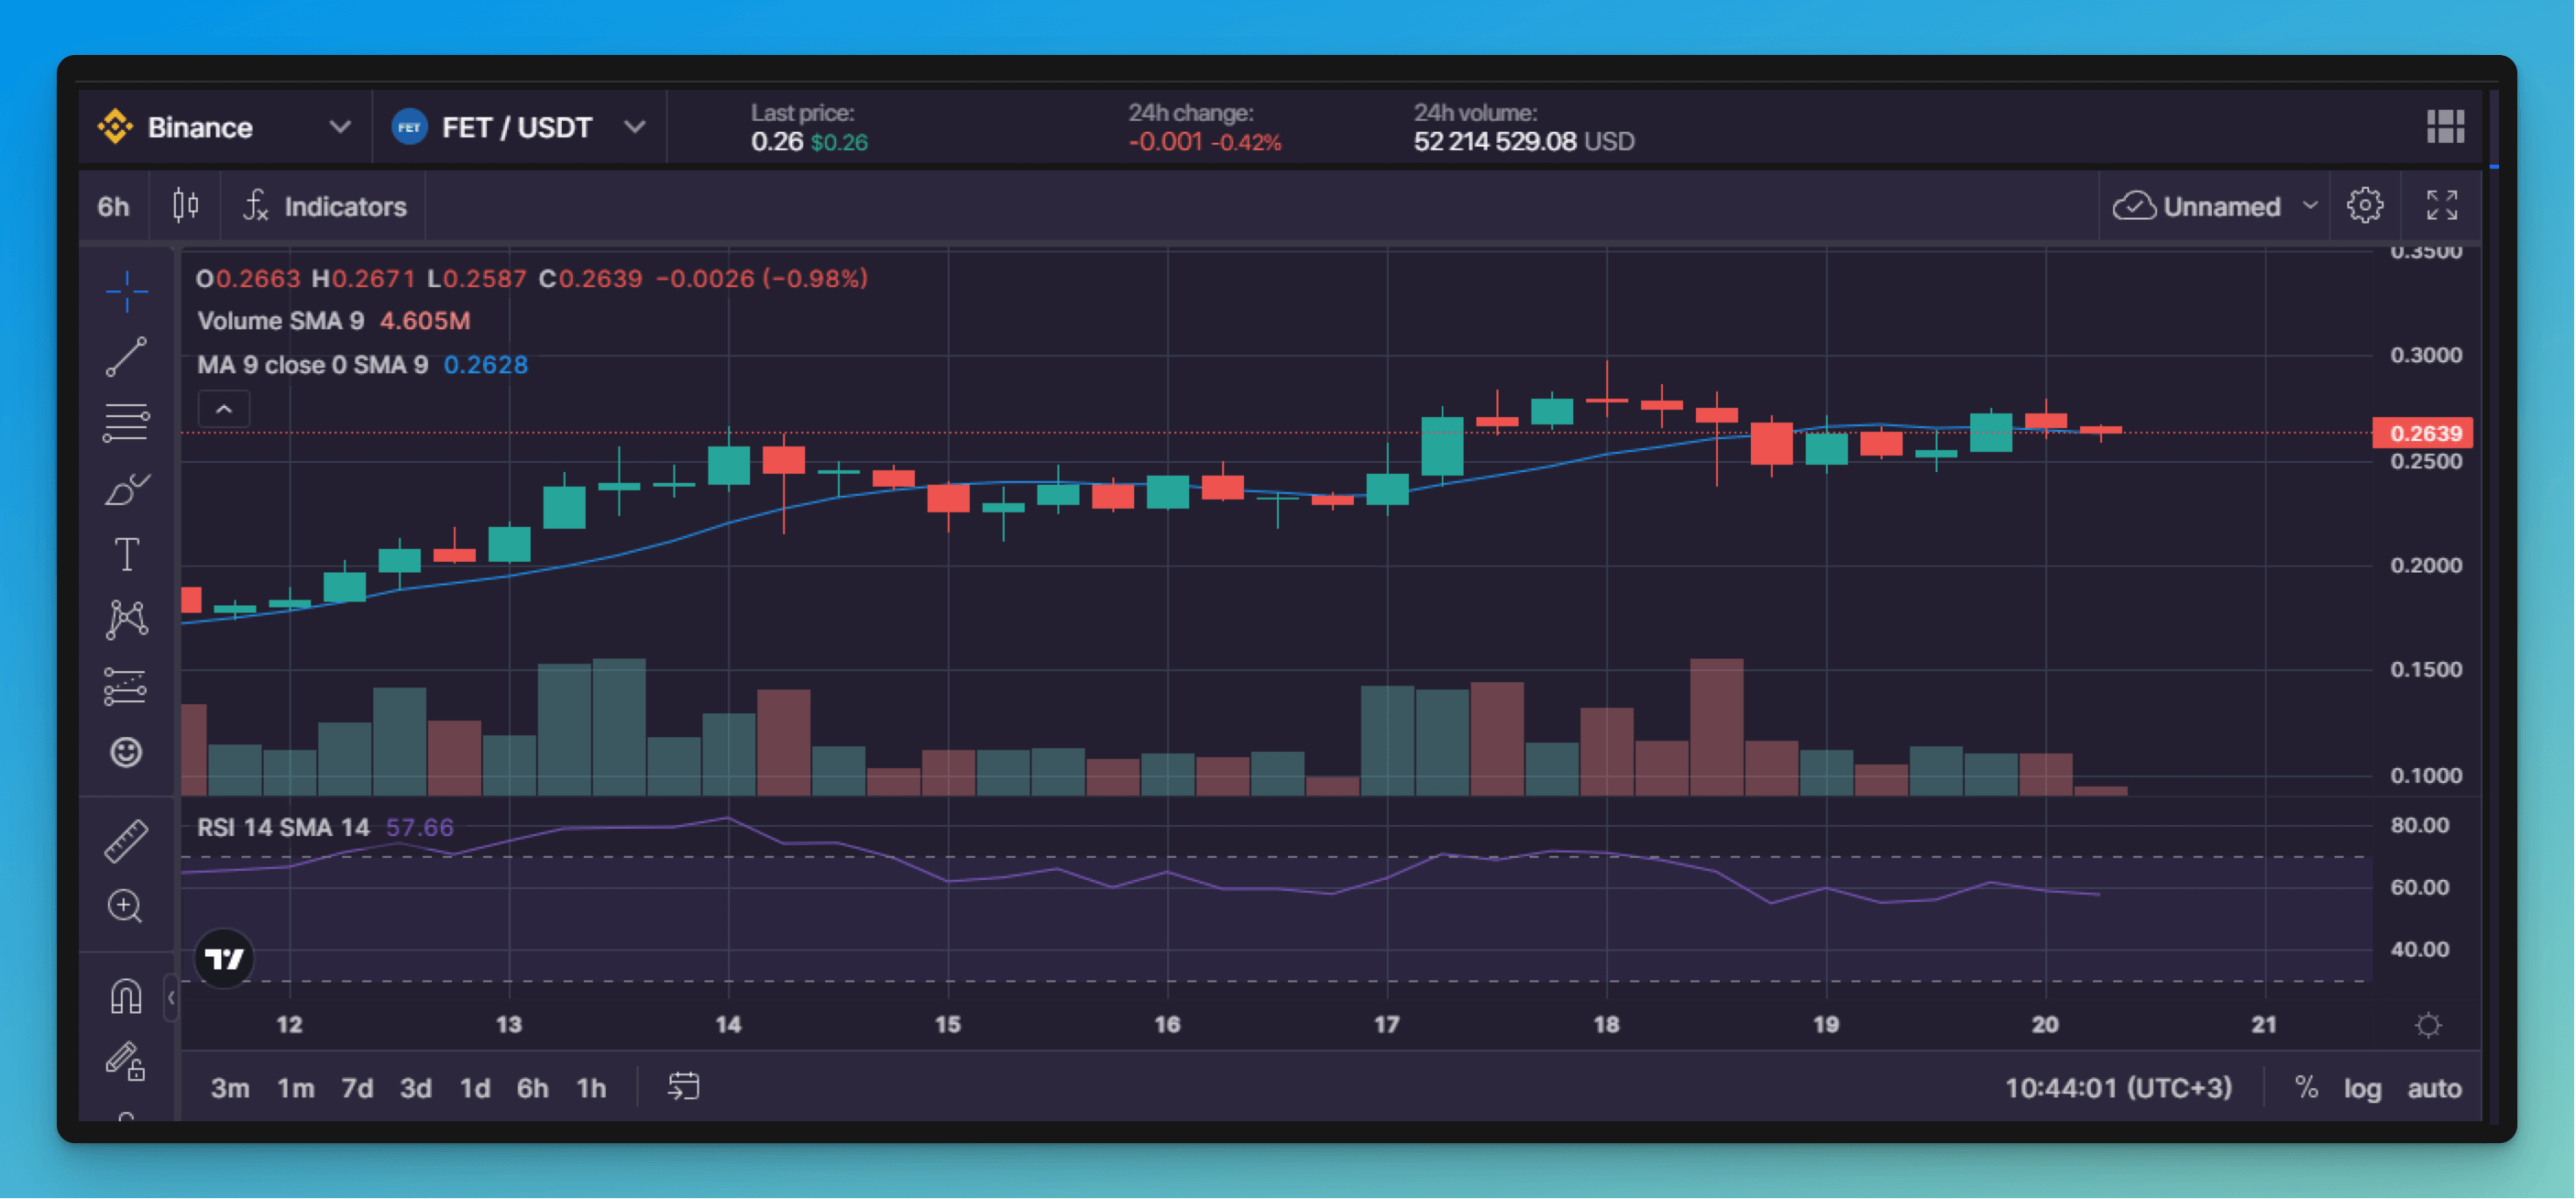
When you click on the Trading tab in Bitsgap’s terminal, you’ll immediately see the chart at the center of your screen (Pic. 4). On the left-hand side of the chart, there are multiple charting instruments that you can use to analyze the market.
On top of the chart, there are icons for time frames, chart types, and indicators. You can select as many indicators as you like. In the picture below, you see the chart with the attached indicators of RSI and MA, and volume.
Technicals Widget
Bitsgap has a fantastic tool for technical analysis called the Technicals widget (Pic. 5) and combines signals of several indicators and oscillators. The widget makes spotting potentially favorable trading opportunities very easy.
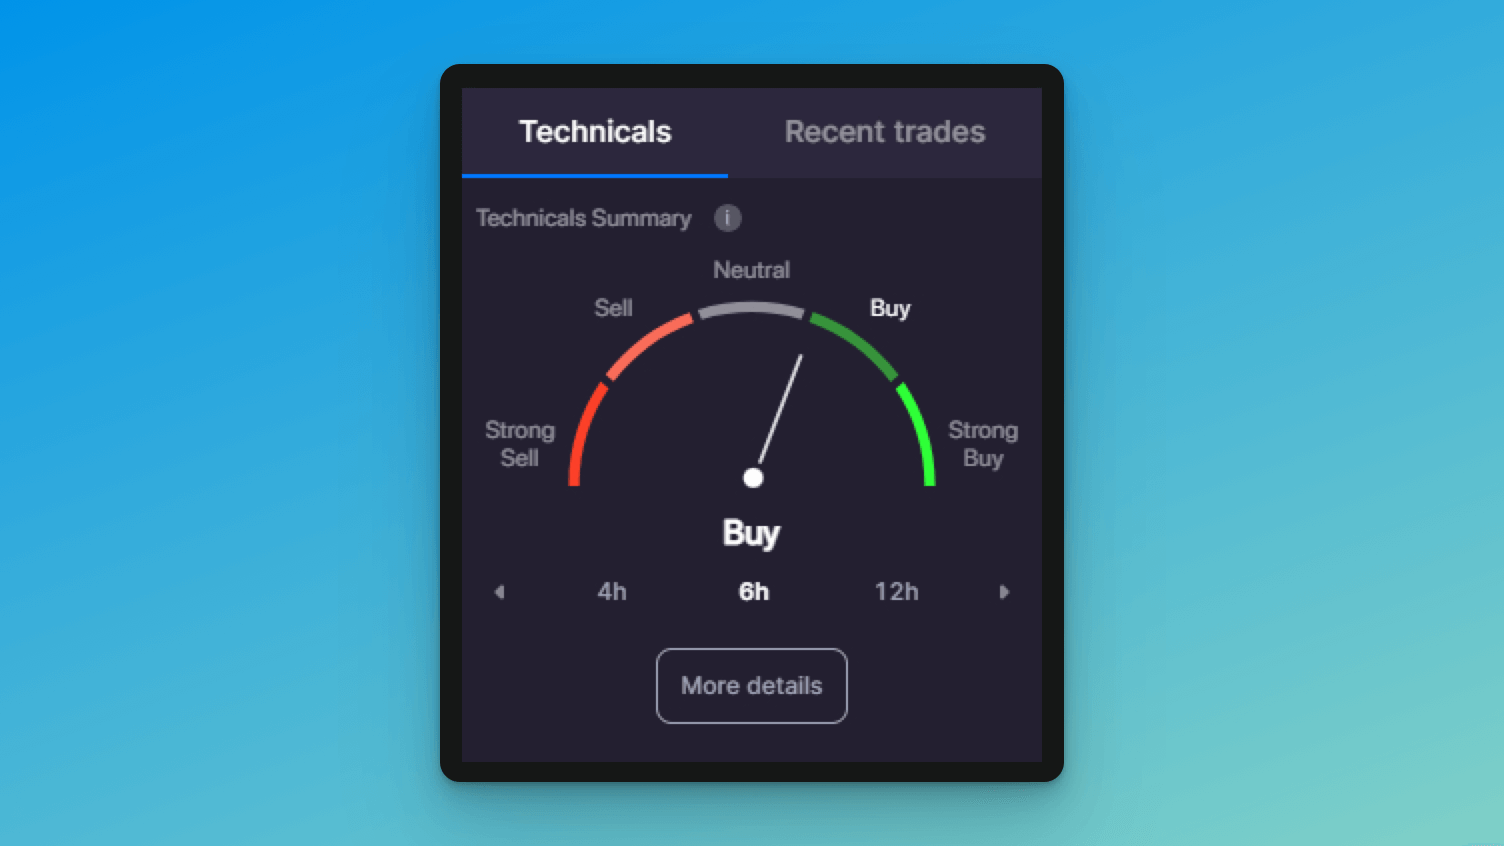
The Technicals tool combines and averages the values of the most popular indicators and shows a real-time technical analysis overview for your chosen timeframe. By clicking on [More details], you’ll see what indicators have been considered for a combined summary.
To learn more about the Technicals widget, head to this blog article.
DCA Indicator-Based Trading
Finally, if you want to supplement your automated trading strategy with powerful indicator signals, you can use the Bitsgap DCA trading bot.
The DCA bot can enter/exit trades as soon as an indicator(s) on a chosen timeframe generates a signal. You can select as many as six indicators in the bot’s [Manual adjustment] section (Pic. 6).
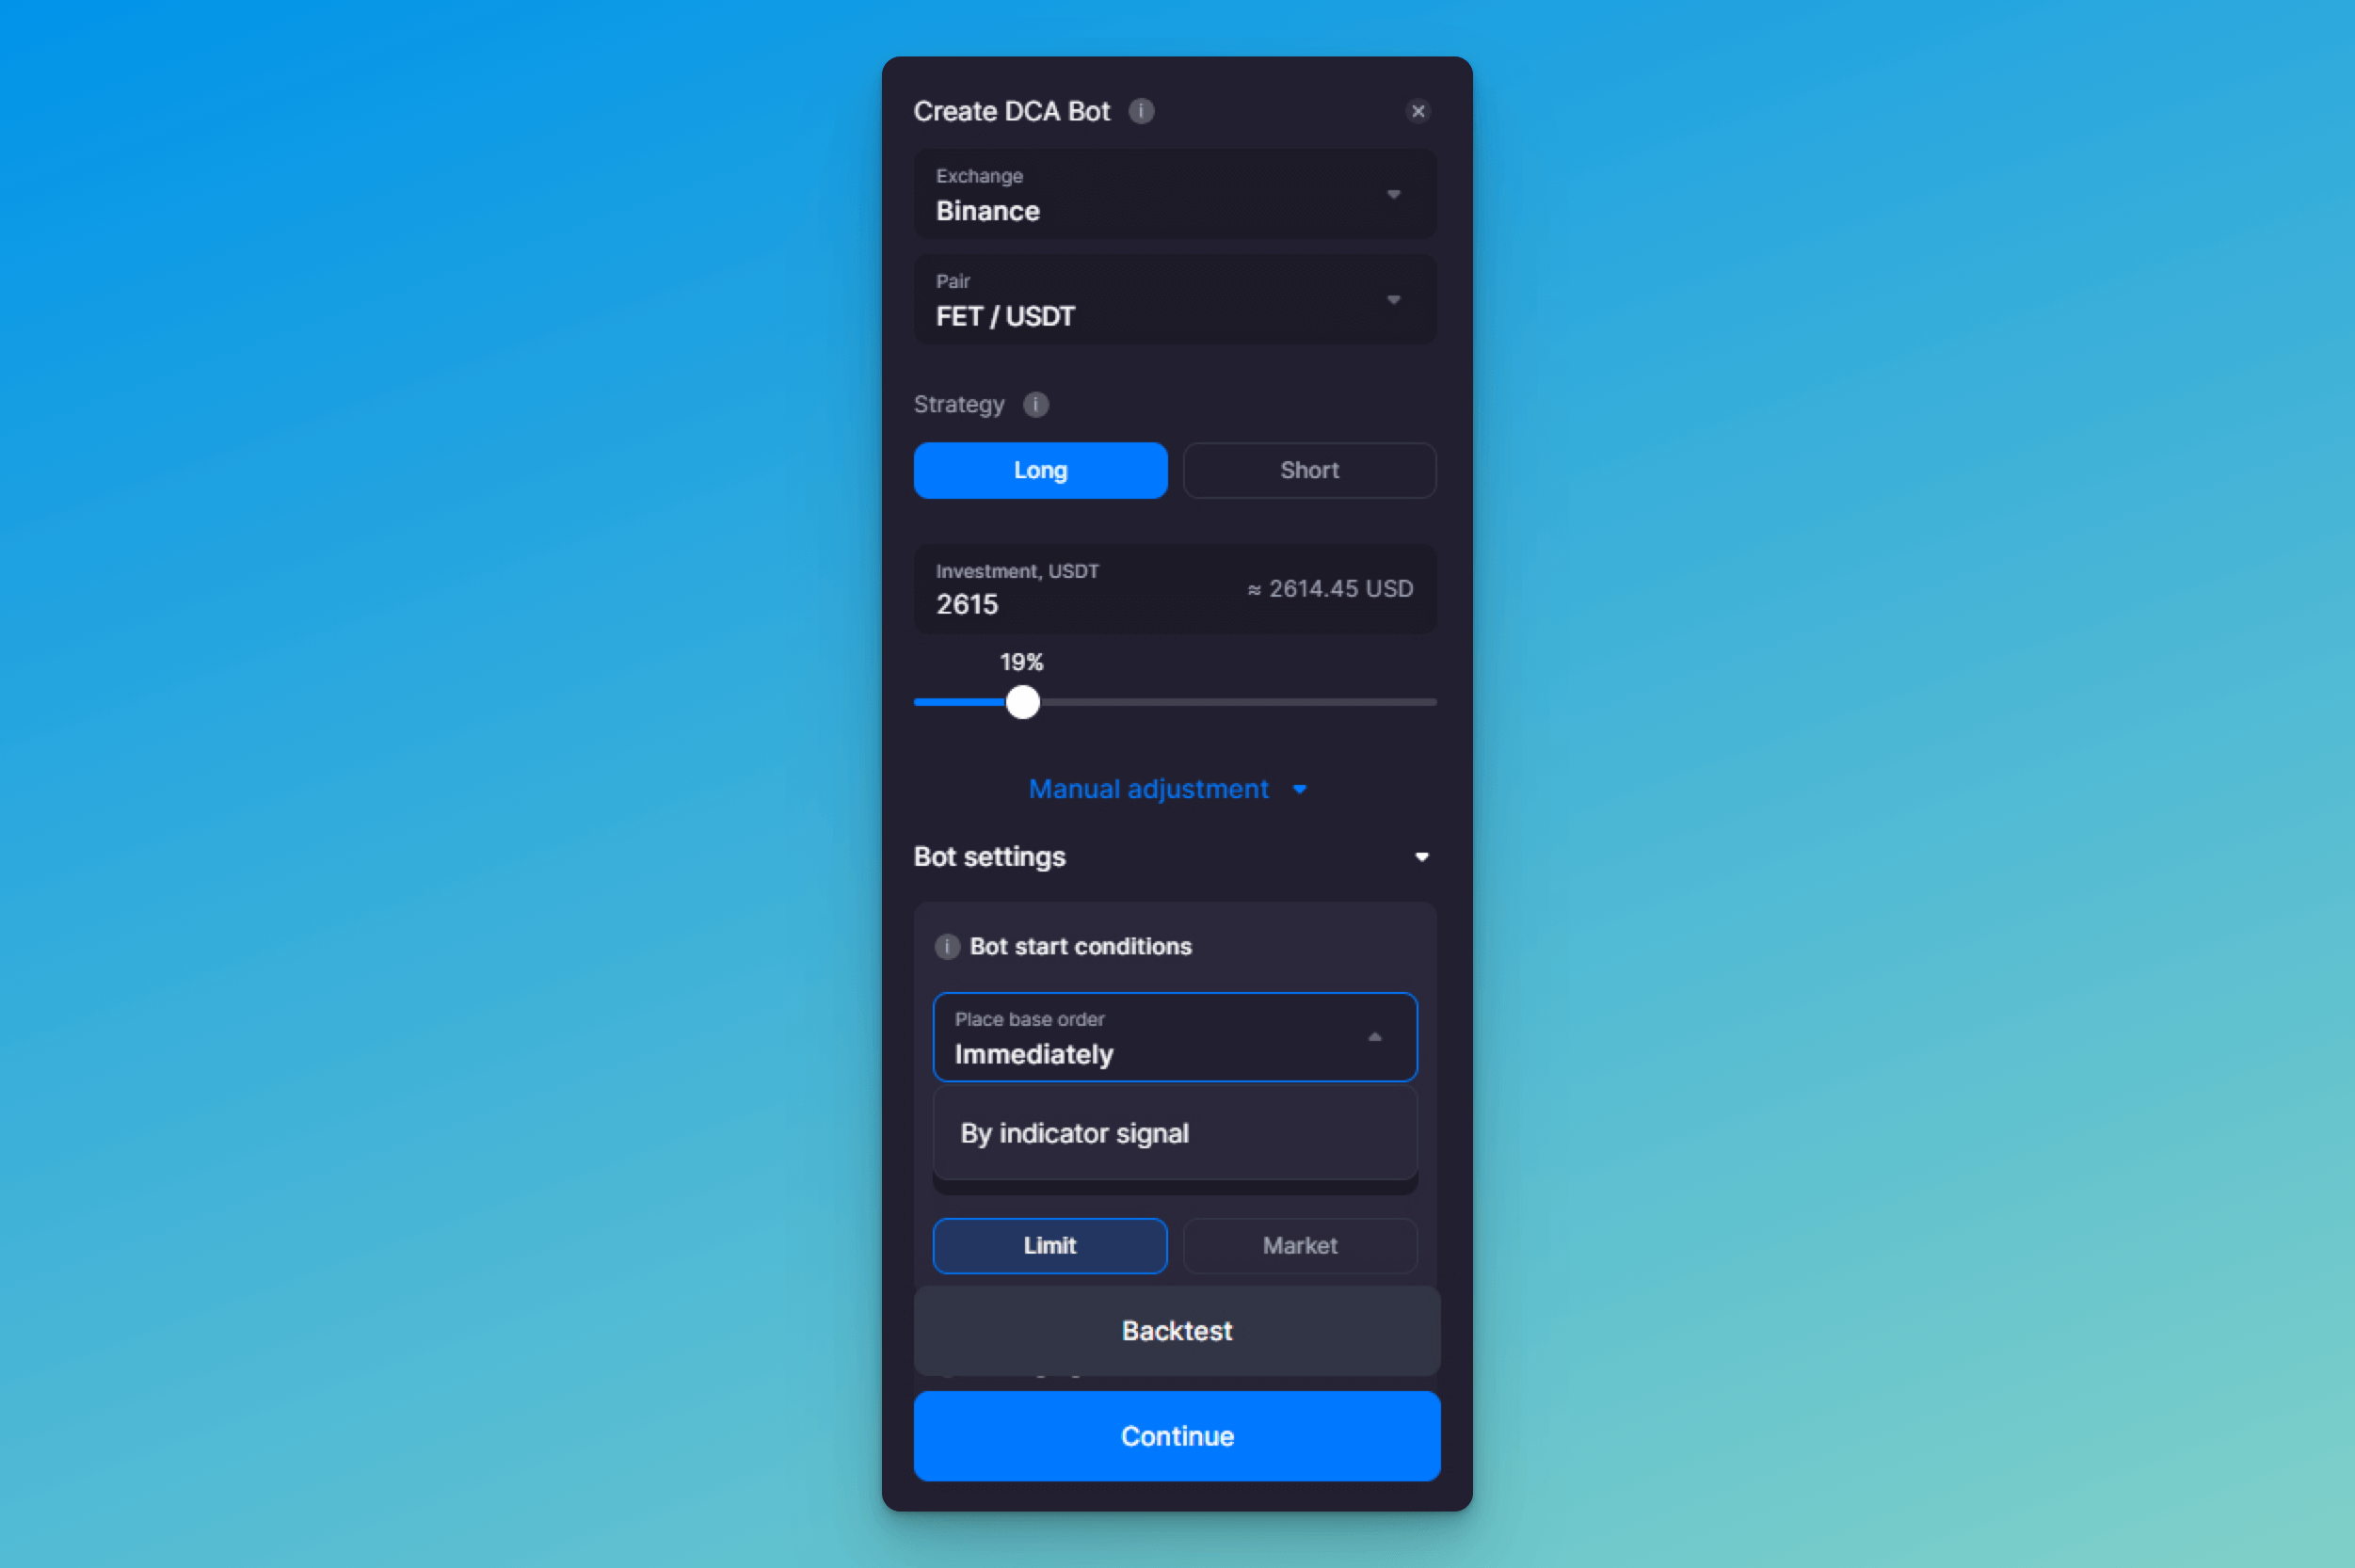
To start your bot with an indicator signal, go to [Manual adjustment] → [Bot settings] → [Bot start conditions] → [Place base order] → [By indicator signal] and select an available indicator.
To close your bot following an indicator signal, go to [Manual adjustment] → [Position TP&SL] → [Percentage of] → [Average price + Indicators] or [Base order price + Indicators].
For example, suppose you choose [Base order price + Indicators]. In that case, your Take Profit percentage will be calculated from the base order price, and the cycle will close with a signal of selected indicators.
To learn more about the DCA bot and all its available settings, please read this article on the blog or visit our Help Center.
Ready to test Wyckoff's strategies? Then head to the Bitsgap platform now.
