Bollinger Bands Explained: Technical Analysis with Bollinger Bands
Discover the nuts and bolts behind one of crypto’s most powerful tools in our exclusive guide breaking down everything Bollinger Bands.
Among the most widely used technical indicators in crypto, Bollinger Bands has become a powerhouse tool for its versatility and predictive precision. Traders rely on this volatility-based indicator to pinpoint opportune market entries and exits, assess trends, and gauge asset overbought or oversold conditions.
But what are Bollinger Bands, how are they calculated, and — most importantly — how can savvy traders harness them? In this article, we’ll unpack the mechanics and interpretations of Bollinger Bands to demonstrate applications across crypto trading strategies.
What Are Bollinger Bands Crypto?: Bollinger Bands Explained + Components
John Bollinger, an American asset manager and technical analyst, developed a technical indicator in 1980 and named it Bollinger Bands (BBs), after himself. Commonly abbreviated as BBs in financial markets, this tool is primarily used to assess the volatility of cryptocurrency prices, as well as other financial assets like stocks, commodities, and forex.
The BBs indicator consists of three bands that serve as volatility indicators, quantifying the relative high and low prices of a cryptocurrency in relation to previous trades. These bands adjust based on standard deviations, which measure volatility. As volatility increases, the space between the bands tends to widen, and conversely, it narrows when the price decreases.
BB Components
As mentioned, Bollinger Bands consist of three lines plotted on a price chart:
- Middle Band: This is typically a simple moving average (SMA) of the closing prices over a specified number of periods, commonly set to 20 periods.
The middle band of Bollinger Bands is essentially the simple moving average (SMA) of a security's price, commonly based on a 20-day period. This average forms the central reference point for both the upper and lower bands and reflects the average price of the security over the chosen timeframe. To calculate the SMA for Bollinger Bands, one simply takes the average of the closing prices over a designated number of periods, often 20. This computed SMA then serves as the middle band, helping traders to spot trends and potential turning points in the market.
- Upper Band: Calculated by adding a multiple of the standard deviation to the middle band. This multiple can be adjusted, but it is often set to 2 standard deviations.
The upper Bollinger Band, which is the top line of the Bollinger Bands indicator, is calculated by adding two standard deviations to the middle band—the 20-day simple moving average (SMA) of the security's price. This setup captures roughly 95% of the price movements between the upper and lower bands, offering traders insights into market volatility and potential overbought situations when prices approach the upper band. It acts as a dynamic resistance level and is useful for traders in determining optimal moments to initiate long positions or close out short positions by signaling when prices may be extending too far from the norm.
- Lower Band: Calculated by subtracting the same multiple of the standard deviation from the middle band.
The lower Bollinger Band signifies a price level that is two standard deviations below the middle band, which is the simple moving average. This lower band helps traders identify periods when the price of an asset is consolidating, potentially indicating an upcoming breakout or trend reversal. When the distance between the upper and lower bands narrows, it indicates a period of low volatility, suggesting that the market might be preparing for a breakout. Traders can use this information to inform their decisions on whether to buy or sell an asset. However, it's crucial to use this indicator in conjunction with other technical tools and consider overall market conditions to validate trading signals.
What Is Bollinger Bands Formula?
The Bollinger Bands formula involves the calculation of three main components: the middle band, which is a simple moving average (SMA), and the upper and lower bands, which are determined based on the standard deviation of the price from the SMA.
Here’s a breakdown of how each component is calculated:
Middle Band
The middle band is simply a simple moving average (SMA) of the closing prices over a specified number of periods. Typically, a 20-period SMA is used, but this can be adjusted depending on the trader's strategy and the time frame they are analyzing. The formula for the middle band is:
Middle Band=SMAClose, N periods
where "Close" refers to the closing prices of the asset and "N" is the number of periods used to calculate the SMA.
Upper Band
The upper band is calculated by adding a set number of standard deviations to the middle band. This number is typically set to 2, but it can be adjusted for more or less sensitivity. The formula for the upper band is:
Upper Band=Middle Band+(𝑘×Standard DeviationClose, N periods)
where 𝑘 is the number of standard deviations to add (commonly 2).
Lower Band
The lower band is calculated by subtracting the same set number of standard deviations from the middle band:
Lower Band=Middle Band−(𝑘×Standard DeviationClose, N periods)
Calculating Standard Deviation
Standard deviation is used to measure the volatility or dispersion from the average, and in the context of Bollinger Bands, it helps determine how far the bands should be from the middle band. The standard deviation for the closing prices over N periods is calculated as:
- Compute the mean (average) of the closing prices for the last N periods.
- For each period, subtract the mean from the closing price to find the deviation of each period from the mean.
- Square each of these deviations.
- Sum all of the squared deviations.
- Divide this sum by N (or N-1 for a sample of a larger population).
- Take the square root of the result.
This gives you the standard deviation used in the formula for the upper and lower bands.
Example
Here's a practical example using a 20-day period:
- Calculate the 20-day SMA for the closing prices.
- Calculate the 20-day standard deviation of the closing prices.
- Set
- 𝑘
- k to 2 (commonly used value).
- Compute the upper band: 20-day SMA + (2 × 20-day standard deviation).
- Compute the lower band: 20-day SMA - (2 × 20-day standard deviation).
By using these calculations, traders can generate the Bollinger Bands to apply to their trading charts and make informed decisions based on the positioning of the price relative to these bands.
How Do You Use Bolinger Bands Indicator?: Bitcoin Bollinger Bands Trading & Interpretations
Bollinger Bands are a versatile tool in technical analysis, providing insights into market volatility and potential price movements. Here’s how traders typically interpret and use these bands to make informed trading decisions:
- Identifying Market Conditions
- Overbought and Oversold Conditions: When the price of an asset touches or exceeds the upper Bollinger Band, the market may be considered overbought. Conversely, when the price touches or dips below the lower band, it might be deemed oversold. These conditions suggest potential reversal points where traders might consider opening or closing positions.
- Volatility Shifts: The width of the Bollinger Bands can indicate the level of market volatility. Narrow bands suggest low volatility, often occurring during consolidative phases, whereas wide bands indicate higher volatility, typically seen in more dynamic market movements.
- The Bollinger Bounce: One of the most straightforward uses of Bollinger Bands is the ‘Bollinger Bounce’, which operates on the principle that the price tends to return to the middle band, or the moving average. Traders might buy when the price hits the lower band and sell when it reaches the upper band, especially in a ranging market where these levels act as support and resistance.
- The Bollinger Squeeze: This strategy is based on the observation that a period of low volatility (narrow bands) often precedes a period of high volatility (expansion of bands). This setup, known as the 'Bollinger Squeeze', can be a signal for traders to brace for a substantial price move. Traders watch for a breakout above or below the bands as a signal to initiate trades in the direction of the breakout, anticipating a new trend.
- Price Targets and Stop-Loss Placement: Bollinger Bands can also help set price targets and stop-loss orders. For example, a trader might set a target near the upper band for long positions or near the lower band for short positions. Similarly, stop-loss orders can be placed just outside the bands to manage risk in case the market moves against the trader’s expectations.
- Combining with Other Indicators: For enhanced effectiveness, Bollinger Bands are often used in conjunction with other indicators. For instance, a Relative Strength Index (RSI) can help confirm whether conditions are truly overbought or oversold. Similarly, Moving Average Convergence Divergence (MACD) can confirm the strength of the trend indicated by the Bollinger Bands.
How Do You Use Bollinger Band for Scalping?
Using Bollinger Bands for scalping can be a highly effective strategy, especially in fast-moving markets. Scalping involves making numerous trades throughout a trading day, capitalizing on small price changes. Bollinger Bands help identify the ideal entry and exit points by providing visual insights into market volatility and price levels. Here’s a step-by-step guide on how scalpers can use Bollinger Bands:
- Setting Up Your Chart
For scalping, it’s common to use a shorter time frame for Bollinger Bands. While the standard setting is a 20-period simple moving average (SMA) with a 2 standard deviation on either side, scalpers might use a 5-minute or 1-minute chart. Adjusting the period to 10 or even 5 can provide more responsiveness to price action.
- Wait for the Bollinger Squeeze
A key setup is the "Bollinger Squeeze" which indicates decreased volatility and typically precedes a significant price move. The bands will contract and tighten around the moving average, signaling that the price is consolidating. Scalpers look for these moments because they often lead to a breakout.
- Identifying Breakouts
Post-squeeze, watch for a sharp breakout where the price moves beyond the upper or lower band. This movement often indicates a strong push in the direction of the breakout. Scalpers enter trades in the direction of these breakouts, aiming to capitalize on the rapid price movement.
- Use of Upper and Lower Bands as Exit Points
Scalpers can use the opposite band as a target or exit point. If buying on a lower band breakout, the upper band can serve as an exit point and vice versa. Quick exits are crucial in scalping to capture small profits from significant price movements.
- Combine with Other Indicators
To increase the effectiveness of a Bollinger Band scalping strategy, integrate other technical indicators:
- RSI (Relative Strength Index): Helps confirm if the breakout is in an overbought or oversold condition.
- MACD (Moving Average Convergence Divergence): Provides additional confirmation of the strength and direction of the price trend.
- Stochastic Oscillator: Useful for confirming momentum and potential reversal points.
- Risk Management
Given the high number of trades in scalping, managing risk is crucial. Scalpers often set tight stop-loss orders to minimize losses. A common approach is to place a stop-loss just outside the opposite Bollinger Band or a few pips outside the breakout candle.
- Practice and Refinement
Like any trading strategy, practice is essential. Use demo accounts to refine your approach to Bollinger Band scalping. Pay attention to how different settings on the bands affect your trading outcomes and adjust your strategy accordingly.
Configuring Bollinger Bands Indicator Settings
Configuring Bollinger Bands involves adjusting several parameters that influence their sensitivity and responsiveness to price changes.
Here are the key settings involved and what each of them means.
Period (Length):
- Definition: The period refers to the number of time bars (e.g., minutes, hours, days) used to calculate the Simple Moving Average (SMA) that forms the middle band of the Bollinger Bands.
- Common Setting: The default setting is usually 20 periods, which provides a good balance between sensitivity and reliability.
- Impact: Increasing the period makes the bands smoother and less reactive to price changes, which could be helpful in filtering out market noise in more volatile environments. Decreasing the period makes the bands more responsive to price changes, which could be beneficial in a fast-moving market or for short-term trading like scalping.
Standard Deviations:
- Definition: This setting determines the distance of the upper and lower bands from the middle band. The standard deviation is a measure of how spread out the prices are from their average value.
- Common Setting: The default is usually set at 2 standard deviations.
- Impact: Increasing the number of standard deviations will widen the bands, which can be useful in highly volatile markets to avoid acting on false signals. Decreasing it will narrow the bands, increasing the sensitivity to price movements but also potentially increasing the likelihood of false breakouts.
Price Type:
- Definition: This refers to the price used to calculate the SMA and the standard deviations. It can be the closing price, opening price, high, low, median (average of high and low), or typical (average of high, low, and close).
- Common Setting: The closing price is most commonly used.
- Impact: Using different types of prices can slightly alter how the Bollinger Bands behave. For example, using the high or low can incorporate more market volatility into the band calculations.
👉 For instance, if you're day trading crypto, you might use a 10-period Bollinger Band with 2 standard deviations on a 5-minute chart to capture more short-term price movements and trends. Conversely, if you're analyzing longer-term trends in a less volatile market, a 20-period setting on a daily chart with 2.5 standard deviations might be more appropriate.
How to Configure Bollinger Bands in Bitsgap
Bitsgap features Bollinger Bands just like the majority of other indicators thanks to its seamless integration of TradingView charts and instruments. Here’s how to set them up:
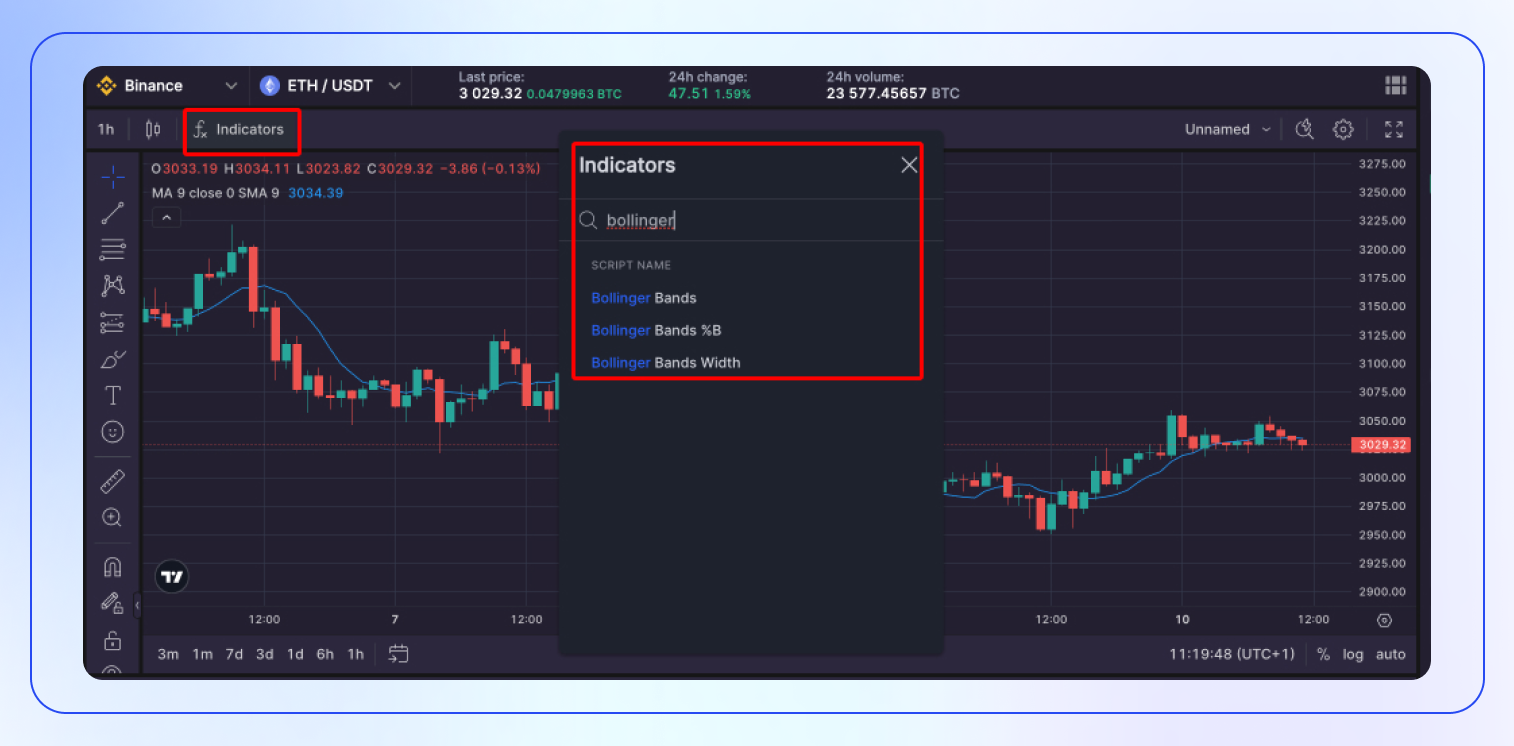
- Find the Indicator: In Bitsgap’s trading platform, locate the “Indicators” section in a toolbar menu.

- Add Bollinger Bands: Select Bollinger Bands from the list to add them to your chart.
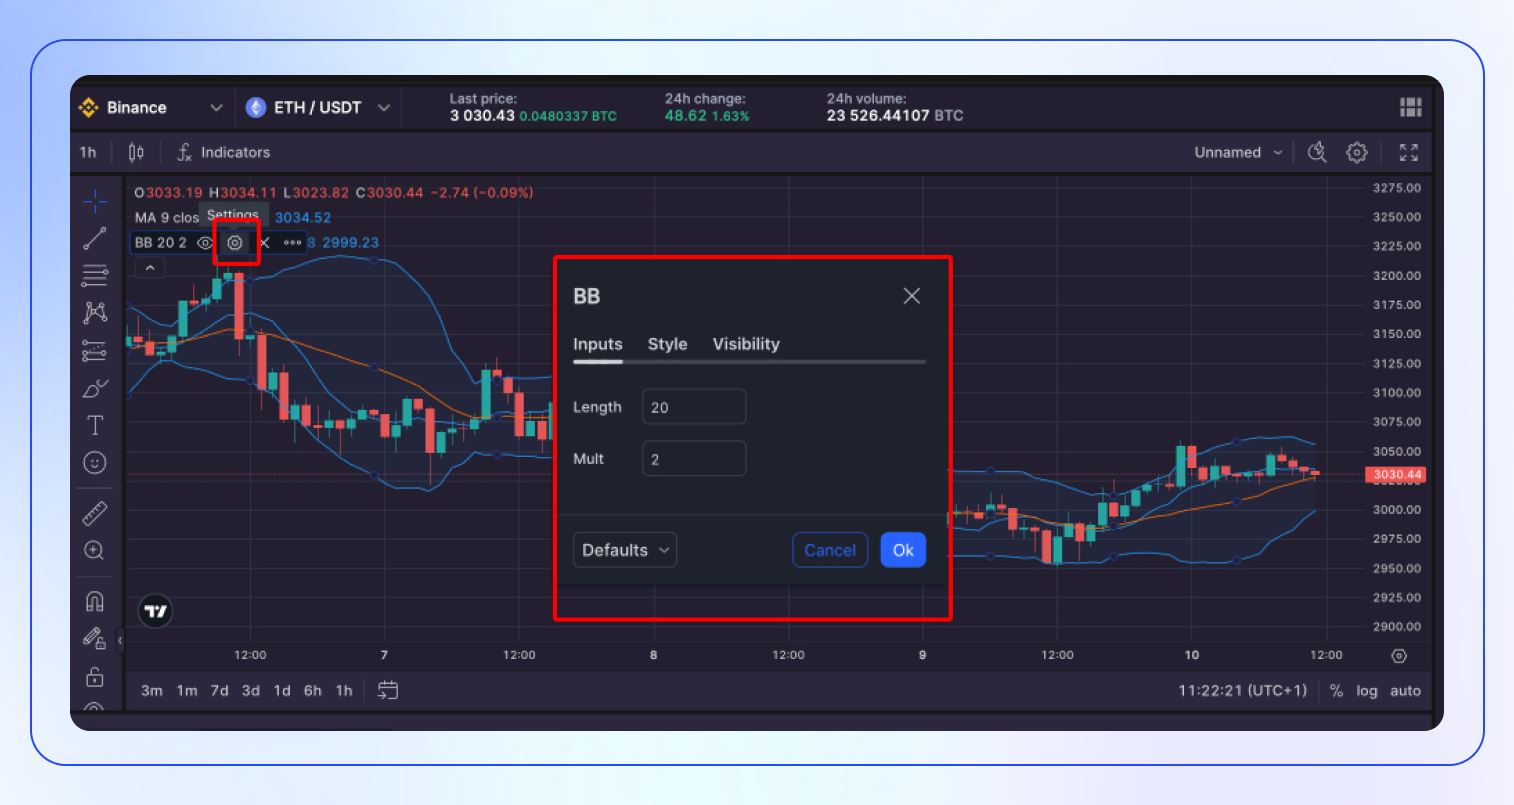
- Adjust Settings: Once the bands are displayed, look for the “Settings” cogwheel icon to edit the indicator.

- Customize Parameters: Enter your desired settings for the period and standard deviations. You also have options for the style and visibility of your bands.
👉 Beyond killer charting, Bitsgap also equips you with an array of robust technical analysis tools. This includes the proprietary Technicals Widget — consolidating signals from over a dozen top indicators and oscillators into one simple, actionable metric. With the Technical Widget, you can avoid information overload by quickly assessing whether markets reflect optimum buy, sell or neutral conditions at a glance. Paired with Bitsgap's suite of automated trading bots running advanced algorithmic strategies around the clock, you have a potent one-two punch to boost results. Sign up now, first seven days are free.
Bollinger Bands Technical Analysis Example
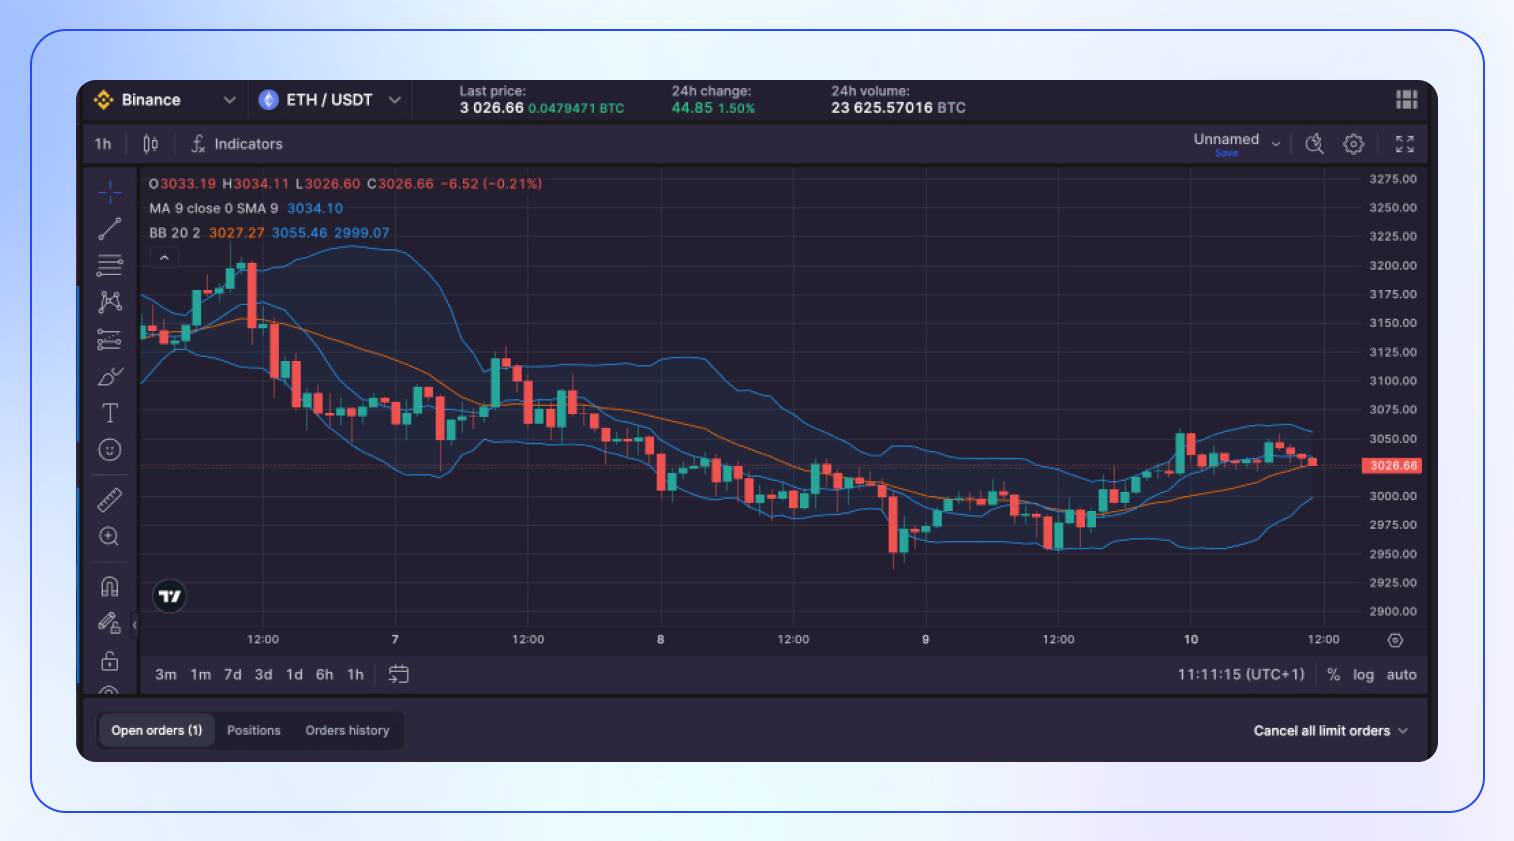
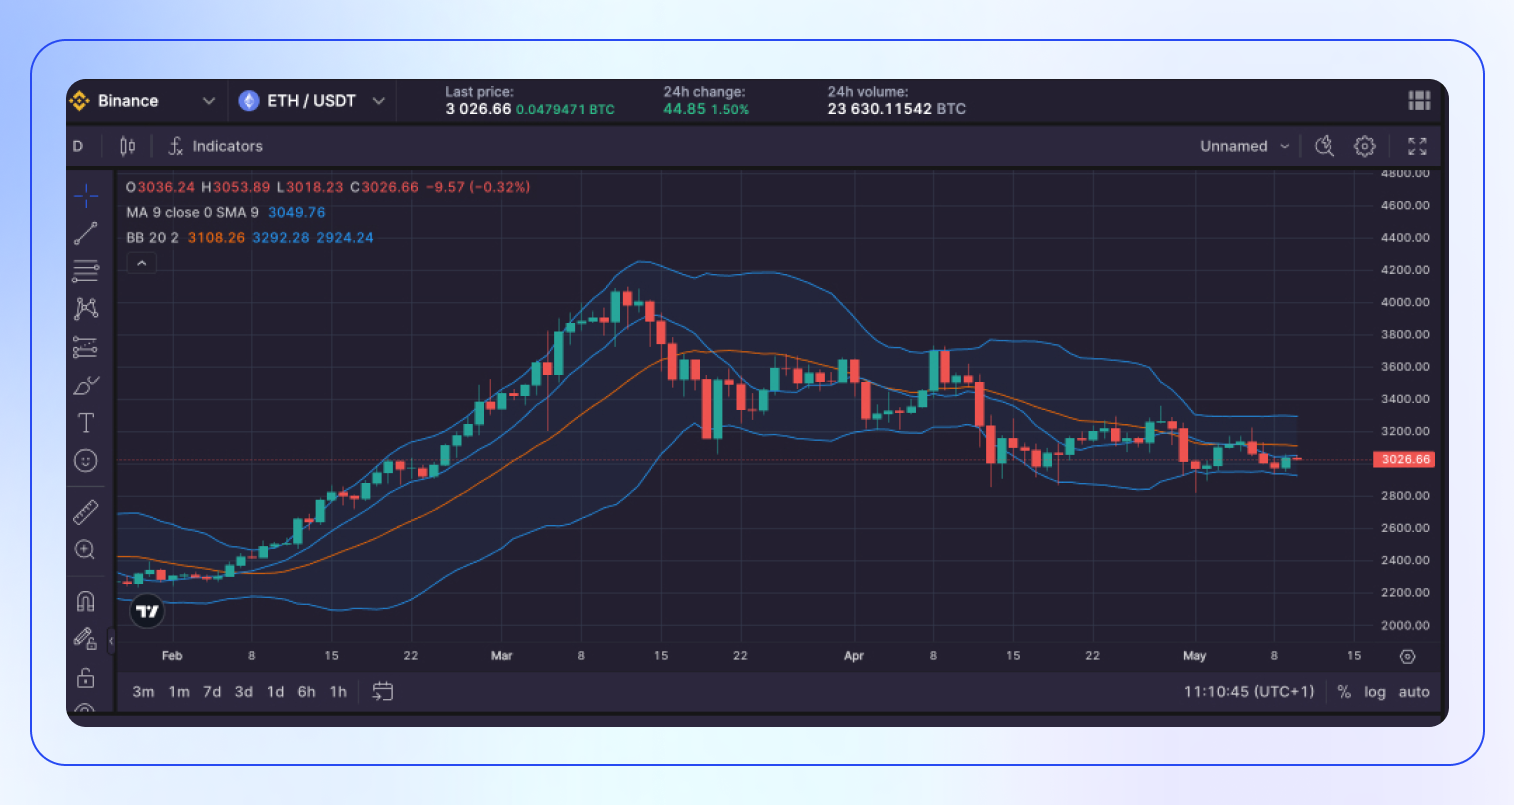
Let’s see how you’d use the Bollinger Band indicator for technical analysis using the following two charts: the hourly and daily charts of ETH/USDT.

Based on the Bollinger Bands indicator on the first chart (1-hour timeframe), the ETH/USDT pair is currently trading near the upper band, which indicates bullish sentiment in the short term. The price is above the moving average (MA) line, which acts as a support level. The bands are slightly narrowed, indicating a period of lower volatility compared to previous wider bands. The prediction for potential price movement in the immediate future is for the price to continue to test the upper band and possibly push towards it if the bullish momentum continues. However, traders should watch for any reversal signs or candlestick patterns indicating potential pullbacks.

On the second chart (1-day timeframe), the ETH/USDT pair has been on a downtrend since the beginning of April. The price has been hovering around the moving average line and is currently below it, suggesting bearish sentiment in the medium term. The Bollinger Bands are moderately wide, indicating ongoing volatility in the market. The lower band could act as a support level, while the upper band could act as resistance. Given the current positioning of the price between the bands, it is likely to expect continued volatility with potential sideways movement in the near term. If the price breaks below the lower band, we may see further downward movement. Conversely, if it breaks above the moving average and upper band, this could signal a potential trend reversal to the upside. However, no strong directional movement is indicated at the moment.
Conclusion
Bollinger Bands are a versatile technical analysis tool for uncovering potential trading opportunities. However, proper interpretation accounting for current market conditions is key for reliability. Band readings differ considerably between trending versus range-bound environments. Therefore, bands should not be used in isolation to identify overbought or oversold levels.
For highest probability signals, bands are best combined with additional indicators like RSI, Stochastic RSI or MACD. This multi-indicator confirmation approach allows experienced traders to effectively determine entry and exit points. No single metric can capture all market complexities. By binding bands to other visual cues, the collective indicators reveal deeper insights together than apart.
