The TAO of Crypto: Decoding the Crypto Technical Analysis
Is your crypto portfolio ready for the next big move? Discover the power of tech analysis and unlock valuable insights into the market's behavior. From breakouts to trends, here's how you can stay ahead of the game.
The crypto tech analysis may not be infallible, but with the right tools and mindset, you can get one step ahead of the crowd. Learn how to gain perceptive insight and identify the best times to trade in the wildly volatile crypto market.
When the crypto markets are in full FOMO or FUD mode, technical analysis can seem useless. But as any seasoned trader will tell you, those emotional times are precisely when rational analysis is most needed. The tools of the trade, from the humble support and resistance levels to the fancifully named Ichimoku clouds, have been tested in the trenches of trading wars for decades. They may not always be right, but they stack the odds in the trader's favor.
Want to know how to gain an edge over the crypto rollercoaster? Read on to discover time-tested techniques for navigating the volatile cryptosphere.
What Is a Cryptocurrency Technical Analysis?
Technical analysis attempts to predict the future direction of an asset’s price based on historical data.
👉 A man who came up with technical analysis was Charles Dow. Charles was a visionary who saw the potential of the stock market and decided to share his insights with the world. Having started with a two-page summary of financial news, he quickly grasped that it was a bull's-eye idea and upgraded his summary to a full-blown newspaper, The Wall Street Journal. In the journal’s editorial column, Charles continued to publish his observations, which became the foundation of Dow Theory.
Since Dow Theory is still relevant today and serves as tech analysis’s foundational pillar, it’s worth going over its main principles:
- The price of assets incorporates ALL information, which means that everything you need to know about an asset is already in its price.
- There are three main market trends. The two most common are bull and bear markets. Corrections in bull markets and rallies in bear markets are examples of secondary market trends, which often move in the opposite direction of the main trend.
- There are three phases to the three main trends: the bull market's accumulation, public participation, and excess stages; the bear market’s distribution, public participation, and panic stages.
- Market indices must correlate to validate a new market trend. For example, if one index is going up and another is going down, the new trend has not yet started.
- Market volumes should move in tandem with the current trend. In a bull market, volume should be increasing, and in a bear market, it should be decreasing. In a bull market, a drop in trading volume may signal the beginning of a negative trend.
- Finally, the trend persists until a decisive reversal. Dow Theory stresses that a market trend will endure until a clear reversal occurs, regardless of changes in the daily price movements.
Jesse Livermore famously said that irrational markets eventually return to rationality, a view supported by Charles Dow's work. So, with a few tools and a bit of ingenuity, mastering market analysis is not impossible.
How Does Technical Analysis Work?
Technical analysis is applicable to any asset with historical trading data, including stocks, futures, commodities, and currencies. It is especially popular in commodities, forex, and crypto markets, where traders focus on short-term price movements.
👉 By studying supply and demand forces as reflected in market price movements, technical analysis attempts to forecast the price movement of nearly any tradable instrument.
Although the field of tech analysis has significantly evolved since Charles Dow's seminal work on the topic, it still operates on the core principles that markets are efficient and that price movements tend to exhibit trends.
Moreover, analysts still agree on the following underlying assumptions:
- Technical analysts believe that everything (including a company’s fundamentals) is already priced into an asset. All that's left is a look at price movements, which are the direct consequence of buying and selling activity in the market.
- Prices, even in random market movements, will exhibit trends regardless of the time frame being observed. In other words, asset prices tend to stick to established patterns rather than move randomly.
- Finally, history tends to repeat itself, and the repetitive nature of price movements is often attributed to predictable market psychology.
Technical Analysis versus Fundamental Analysis
When it comes to studying the markets’ behavior, fundamental analysis and technical analysis are two major approaches at opposite ends of the spectrum.
Fundamental analysis involves evaluating assets by measuring their intrinsic value. This approach considers everything from the overall economy and industry conditions to the financial condition and management of companies.
On the other hand, technical analysis differs from fundamental analysis in that it focuses solely on an asset’s price and volume. The core assumption is that all known fundamentals are already reflected in the asset’s price.
👉 Technical analysts do not attempt to measure an asset’s intrinsic value. Instead, they use charts to identify patterns and trends that suggest what an asset will do in the future.
While both approaches have their own unique advantages and limitations, a combination of the two can provide a more comprehensive understanding of an asset’s performance.
By incorporating both fundamental and technical analysis into your research, you can make more informed investment decisions and achieve greater success in the markets.
What Are the Technical Analysis Main Indicators
Technical analysis trading has spawned hundreds of patterns and signals designed by researchers to aid in forecasting price movements.
But don’t stress it — all indicators typically fall into the following broad categories:
- Price trends
- Chart patterns
- Support and resistance
- Volume and momentum indicators
- Moving averages
- Oscillators
Let’s break all of that down.
Price Trends
All markets exhibit trends, which can be classified into three main types: uptrends, downtrends, and sideways movements in a channel or consolidation (Pic. 1).
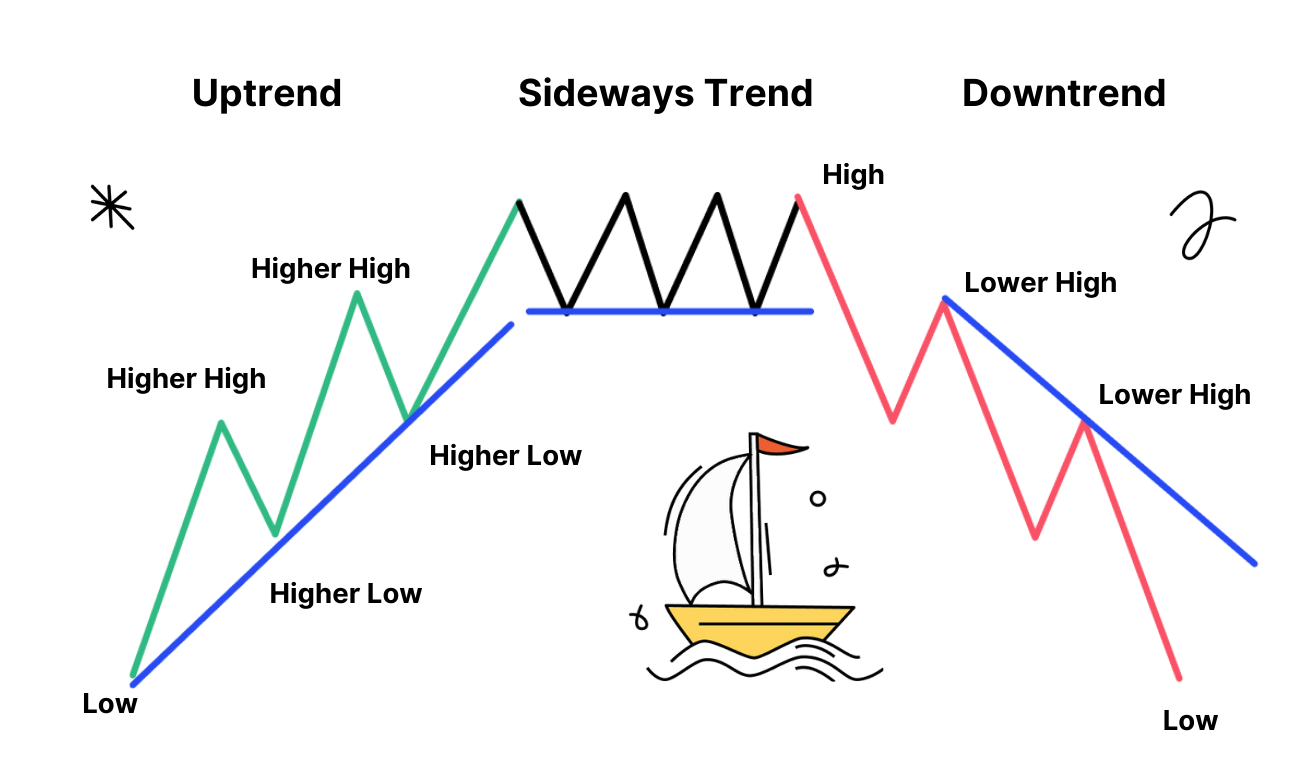
- Uptrends are characterized by higher highs and higher lows, and can be plotted on a chart by drawing an uptrend line under price, linking the lows.
- Downtrends are identified by a series of lower lows and lower highs, and the trend line is drawn above price by linking the highs.
- Occasionally, the market will move sideways within a narrow range during an uptrend or downtrend, creating a consolidation trend. These markets are often uneventful.
Chart Patterns
Price patterns in asset charts can indicate shifts between upward and downward trends. These patterns are identifiable configurations of price movements that can be traced using trendlines and curves. Traders use a variety of patterns to make informed trading decisions, but most typically fall into two categories: continuation and reversal.
Continuation Patterns
A continuation pattern is a brief pause in an existing trend, where bulls take a break during an uptrend or bears relax during a downtrend. While a price pattern is forming, it is challenging to predict whether the trend will continue or reverse, so careful attention must be paid to the trendlines used and whether the price breaks above or below the continuation zone. Technical analysts advise assuming that a trend will continue until it is confirmed that it has reversed.
👉 Generally, the longer and larger the pattern, the more significant the move once the price breaks above or below the continuation zone.
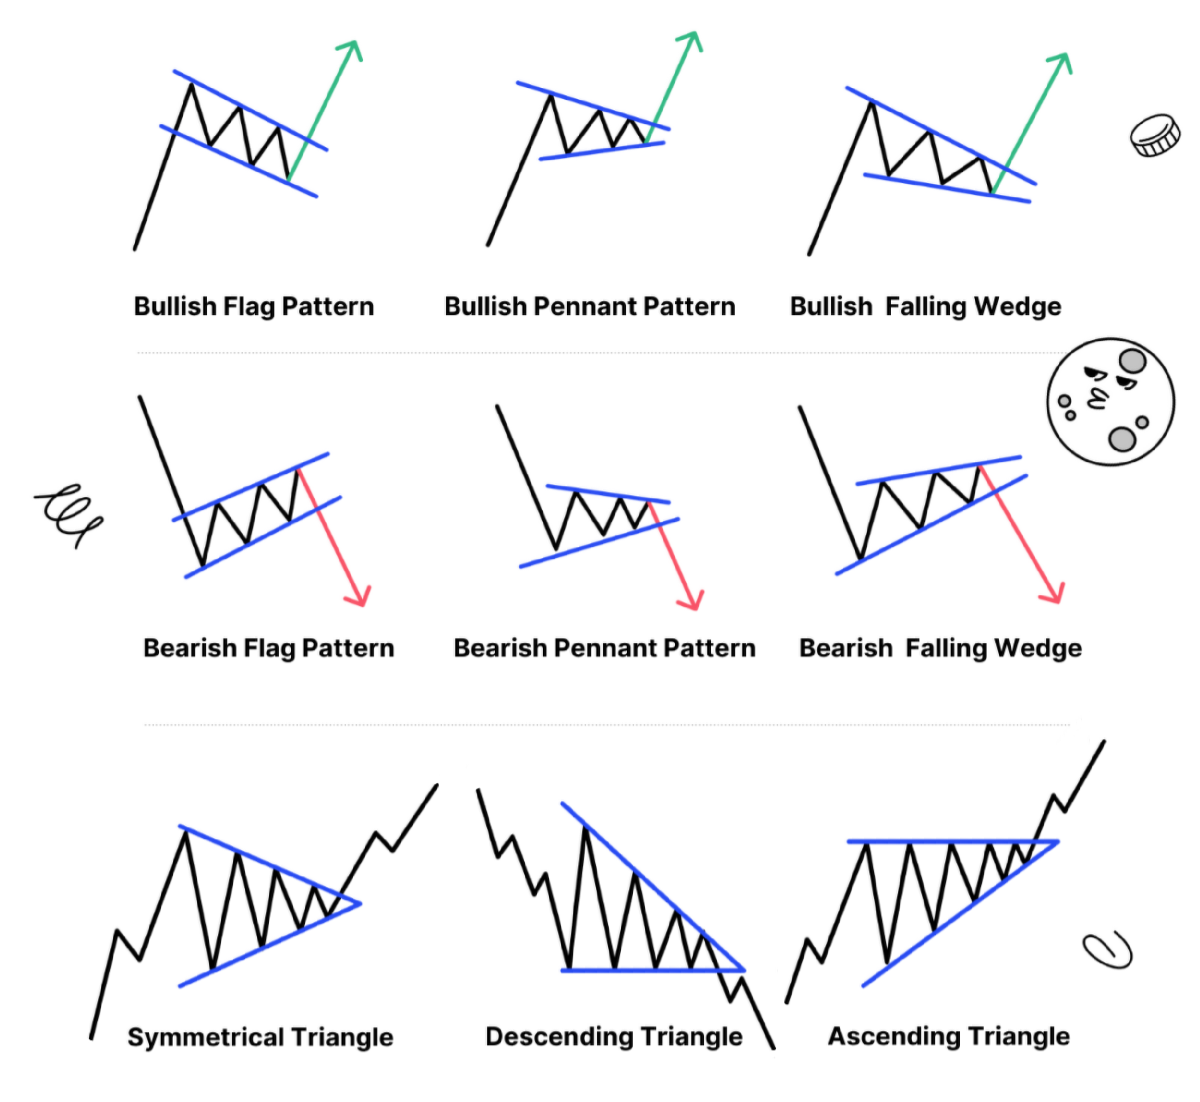
Common continuation patterns include pennants, flags, wedges, and triangles (Pic. 2):
- Pennants are formed by two converging trendlines;
- Flags are drawn with two parallel trendlines;
- Wedges are made by drawing two trendlines that, if they were long enough, would converge to form a point.
- Triangles are among the most popular chart patterns in technical analysis as they occur most frequently. The three most common types are symmetrical, ascending, and descending. The symmetrical triangle takes shape as the upper and lower price borders slowly converge to a single point. The ascending triangle inspires hope of a breakout, as price hits its head on a ceiling and lifts its base to higher ground. The descending triangle, on the contrary, signals the reverse and shapes as the upper trendline descends and tags the price down.
Reversal Patterns
A reversal pattern is a price pattern that indicates a shift in the existing trend. These patterns arise from a period where both the bulls and bears lose steam, leading to a pause in the established trend.
👉 For instance, an uptrend supported by bullish enthusiasm may experience a pause due to even pressure from both the bulls and bears, eventually giving way to the bears and leading to a change in trend to the downside. Reversals occurring at market tops are known as “distribution patterns," while those occurring at market bottoms are known as “accumulation patterns.”
Common examples of reversal patterns include (Pic. 3):
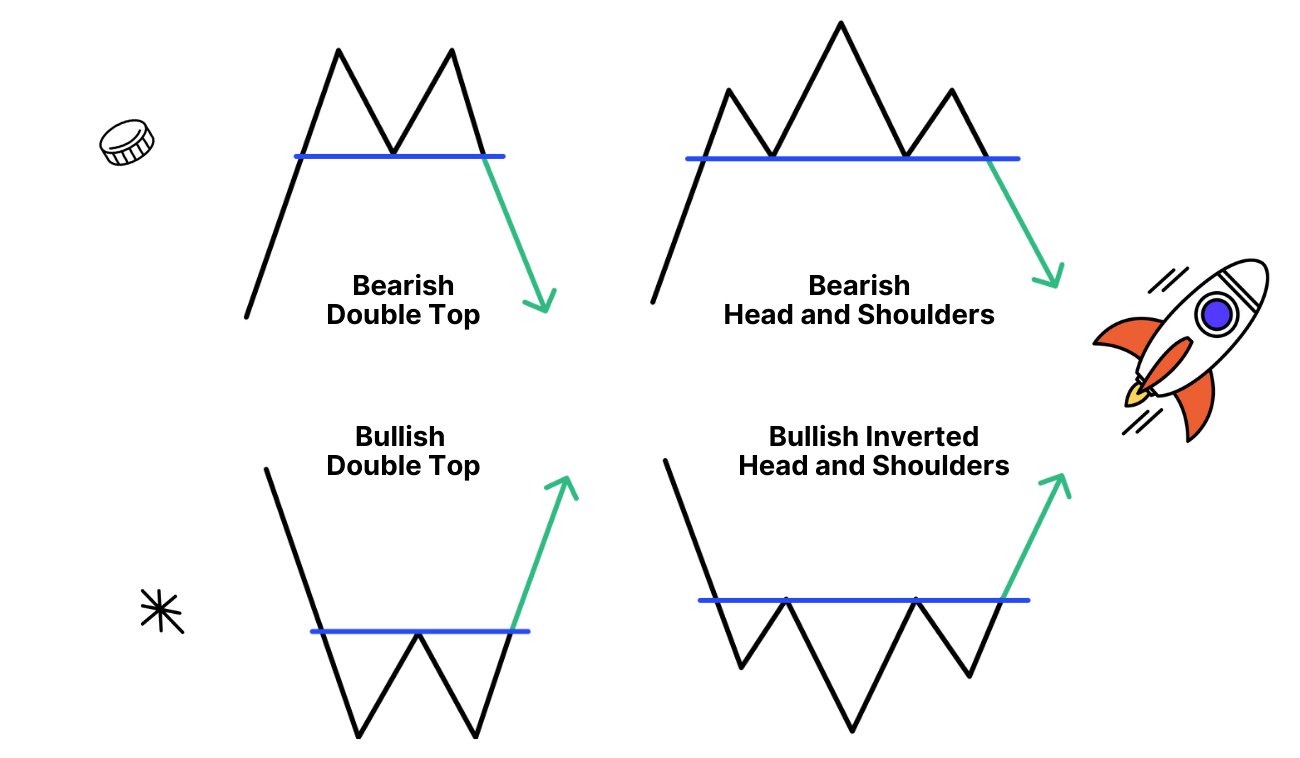
- Head and Shoulders patterns appear at market tops or bottoms as a sequence of three pushes: an initial peak or trough, a second and greater one, and a third push that duplicates the first.
- Double Tops (aka “M” top) represent a short-term move high, followed by a failed attempt to break above the resistance level.
- Double Bottoms (aka “W” bottom) indicate a short-term move low, followed by another failed attempt to break below the support level.
Support and Resistance Levels
Support and resistance are one of the most important levels on charts that form when supply and demand converge (Pic. 4):
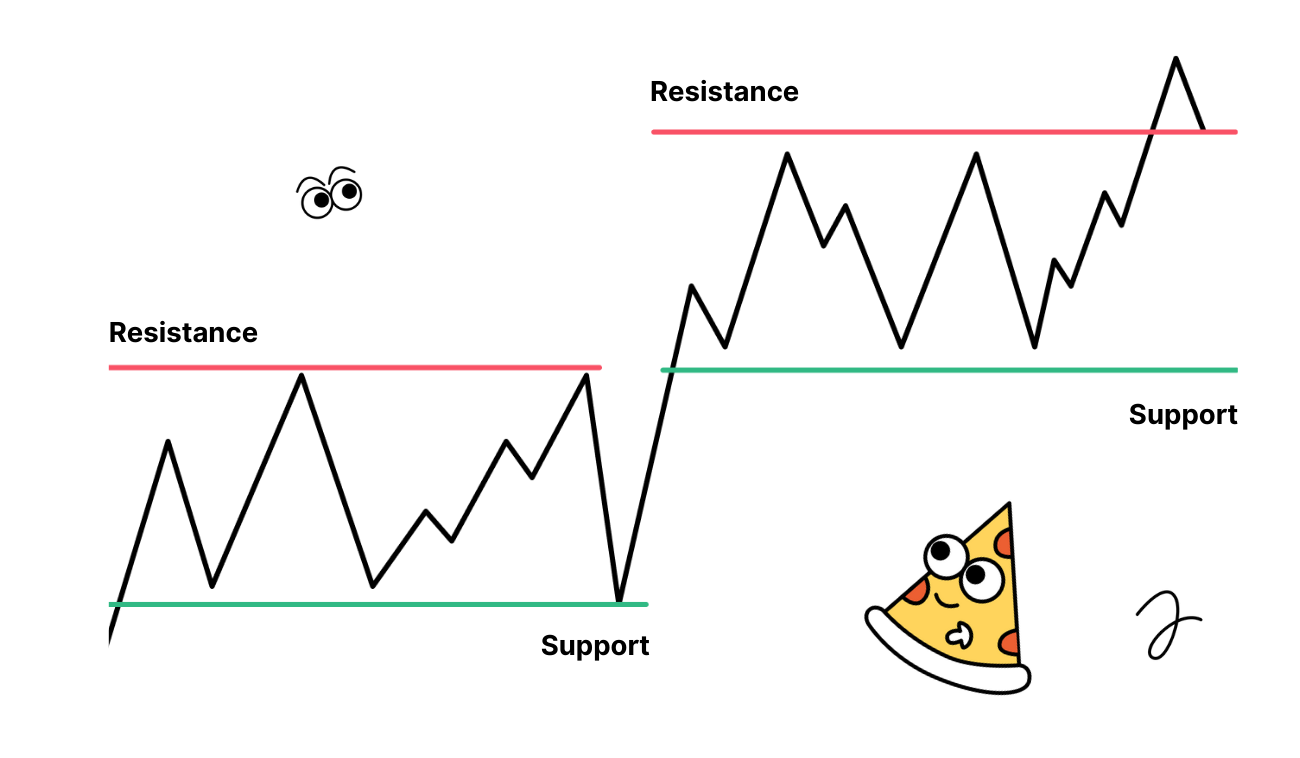
As demand for a cryptocurrency rises and matches the available supply, the downtrend in the asset's price comes to a halt. Traders then attempt to breach the support level multiple times, testing its strength. If the support level withstands several tests, traders feel more confident about entering long trades. However, there are instances when prices drop below the support level, plummeting even further until a new support level is established. The level that provided support in the past becomes a new resistance level.
As prices soar during an upswing, they eventually reach a point of equilibrium where supply meets demand. It is at this critical juncture that more and more investors are willing to sell, leading to a surge in supply that exceeds demand. Despite the seeming equilibrium, the resistance level will be tested repeatedly as traders try to breach it.
If successful, it can signal a shift in market sentiment, with traders feeling more confident in shorting the asset. However, there are times when prices manage to break through the ceiling. This breakthrough often leads to continued price increases until a new resistance level is established, morphing the past resistance into a new support level in the meantime.
Volume and Momentum Indicators
When considering trading an asset, its total volume and change over time can indicate its potential volatility and investor interest.
👉 On the contrary, the absence of volume can make buying or selling difficult, resulting in a wider spread and less market efficiency.
To assess volume, you can use a volume indicator on a trading chart, which shows the volume bars corresponding to the selected time period for candlesticks.
Ultimately, understanding a cryptocurrency's volume can provide valuable information about its trading potential and help inform price direction.
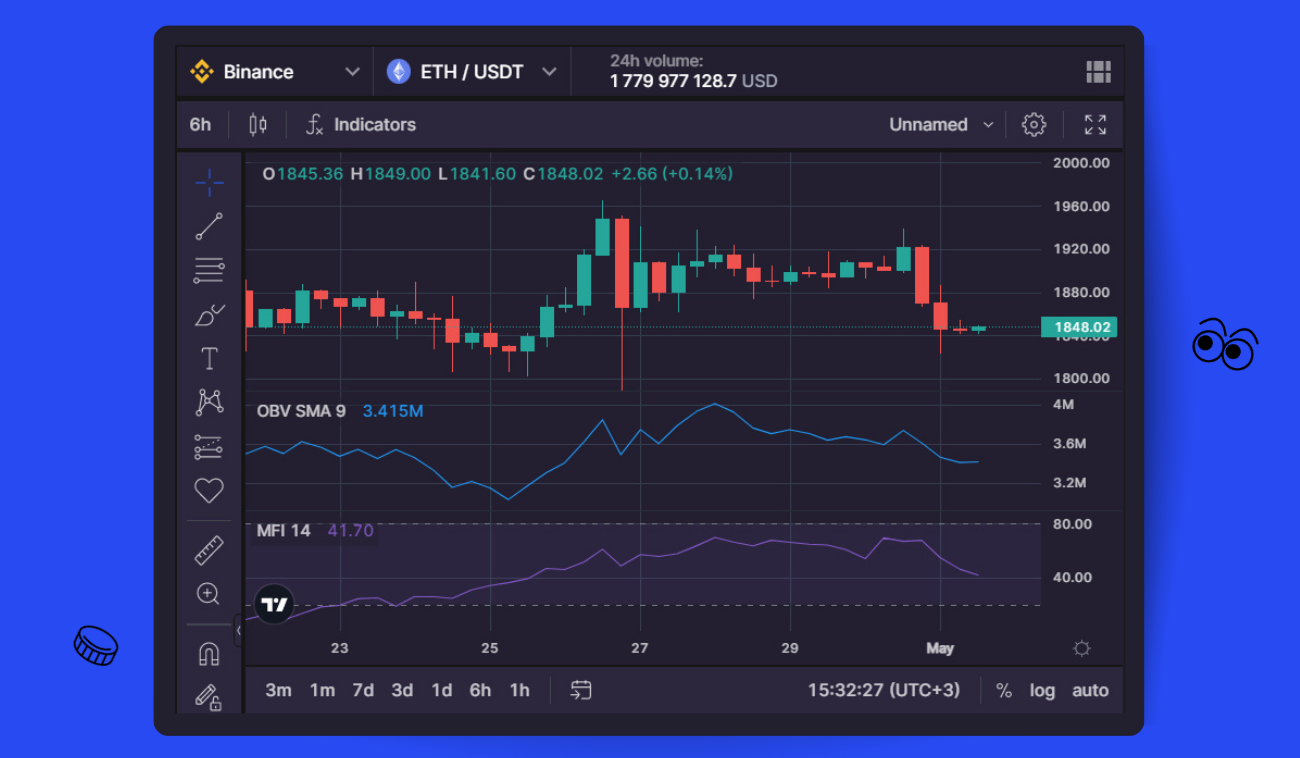
These are a few common volume indicators (Pic. 5):
- On Balance Volume (OBV) is a compound indicator that tracks volume on up days and subtracts it on down days to assess buying and selling pressure. If the closing price finishes higher than the previous day, OBV labels the entire day's volume as up-volume. It assumes the buying pressure from upbeat investors must have dominated to lift the price. Likewise, if the closing price sinks below the prior close, OBV counts that day's full volume as down-volume, convinced the selling from disheartened traders must have prevailed to depress the price.
- Money Flow Index runs from 0 to 100 and combines volume and price action to determine whether the market is getting overheated. It calculates positive and negative money flows based on price changes, with a rise in price indicating positive money flow and purchasing pressure, while a drop in price indicates negative money flow and selling pressure. Readings near the top of the MFI scale suggest the bulls may be overheating, with buying volume and price change getting extreme. Numbers close to the bottom of the range imply the bears could be overdoing it, with selling volume accelerating price declines to unsustainable levels.
Momentum indicators track how fast crypto prices are changing to determine if the market is gaining or losing steam. They measure the velocity of price shifts to identify powerful trends.
The two most popular momentum indicators (Pic. 6) are:
- The Relative Strength Index (RSI) shows how strong or weak a crypto’s price momentum is on a scale of 0 to 100. A high RSI means the crypto is overbought, while a low RSI means it’s oversold.
- The Moving Average Convergence Divergence (MACD) measures the relationship between two moving averages of a stock’s price. When the MACD crosses above its trigger line, it signals increasing upward momentum. When it crosses below the trigger line, it indicates decreasing momentum.
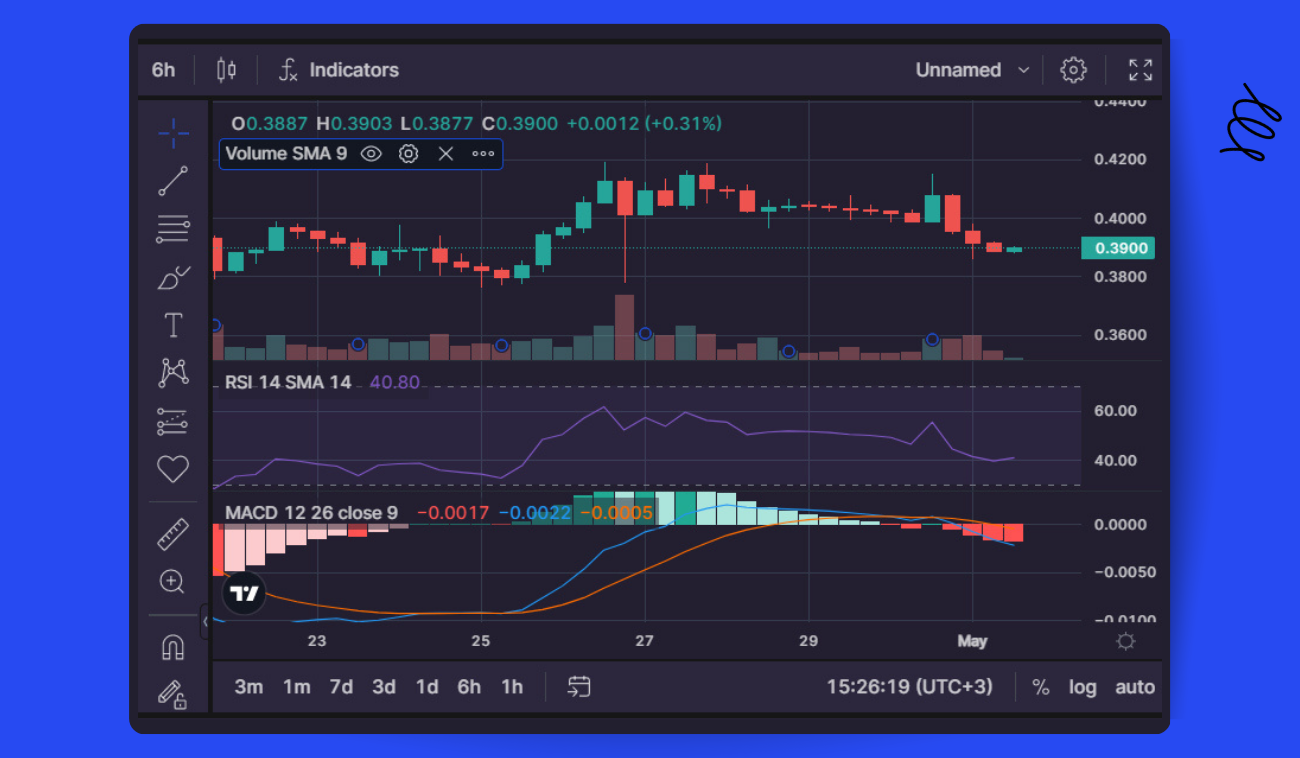
It’s important to note that momentum indicators are most useful in rising markets where bullish trends last longer. They identify crypto as having strengthening momentum to ride the trend. In falling markets, momentum fades quicker as bearish trends typically end faster. So momentum indicators are less effective at timing trends during market declines.
Moving Averages
Moving Averages (MA) are among the most crucial and commonly used indicators, which also serve as the basis for many other indicators.
👉 For instance, the MACD oscillator and Bollinger Bands are two indicators that are based on Moving Averages.
By consolidating and averaging price data, Moving Averages (MA) help to eliminate noise and highlight trends, thereby enabling traders to make informed predictions about future price movements in the market.
Moving Averages (MA) are calculated by adding up the preceding data points (or candles) and then dividing the total by the number of points. In practical terms, a 20-period MA is obtained by adding up the past 20 periods and dividing the sum by 20, while a 100-period MA is obtained by adding up the past 100 periods and dividing the sum by 100.
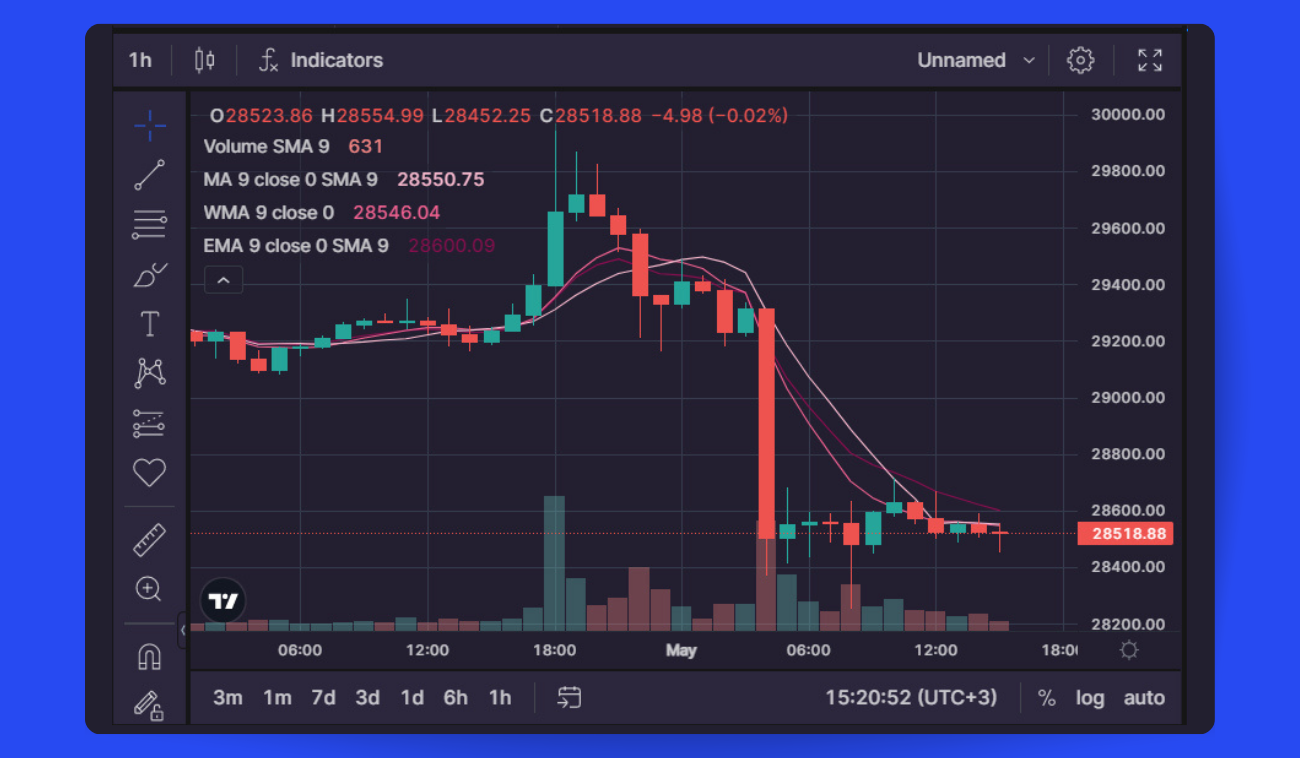
These are the three key types of MAs (Pic. 7):
- Simple Moving Average (SMA) is a go-to tool for cryptocurrency traders that computes the average closing price of a digital currency over a defined period. The 50-day and 200-day MAs are the most common flavors of SMA used by traders. In practice, the SMA generates a line graph that is juxtaposed with the cryptocurrency's price data, facilitating trend analysis.
- Weighted Moving Average (WMA) is a similar indicator to the SMA, but with a twist — it assigns different weights to each data point. By giving more weight to recent prices, the WMA creates a more accurate representation of current price changes.
- Exponential Moving Average (EMA) is like the WMA's sophisticated sibling, with an exponential rate of decrease between one price and its preceding price. This makes it even more precise in reflecting current price movements.
Oscillators
An oscillator is a technical analysis tool that is used to gauge the momentum of an asset's price moves. It operates by confining the asset's price fluctuations within a bounded range, with an upper and lower barrier representing extremes in the price’s normal behavior. As the price approaches these barriers, the oscillator signals that an asset may be overbought or oversold, suggesting the price move has become rather turbulent and is due for a reversal.
👉 Rather than being accurate forecasts of future movements, oscillators signal that an asset's short-term rally or decline may need to catch its breath before resuming the trend.
The oscillator is often paired with moving averages to determine whether a burst outside the oscillator's barriers represents a meaningful break or just a temporary lark.
For short-term traders, oscillator signals flag moments when the price is tamed for a fleeting opportunity to profit. Over the long run, analysts use oscillators to confirm whether trends remain healthy or are poised to reverse.
One of the most important yet often overlooked oscillators is the Stochastic Oscillator (Pic. 8), a clever little tool for gauging an asset's price momentum. It works by comparing the latest closing price to the high-low range over a given time period. The premise is simple: when the closing price is pushing up near the high end of that range, momentum is strong; when the close approaches the lower end, momentum is fading.
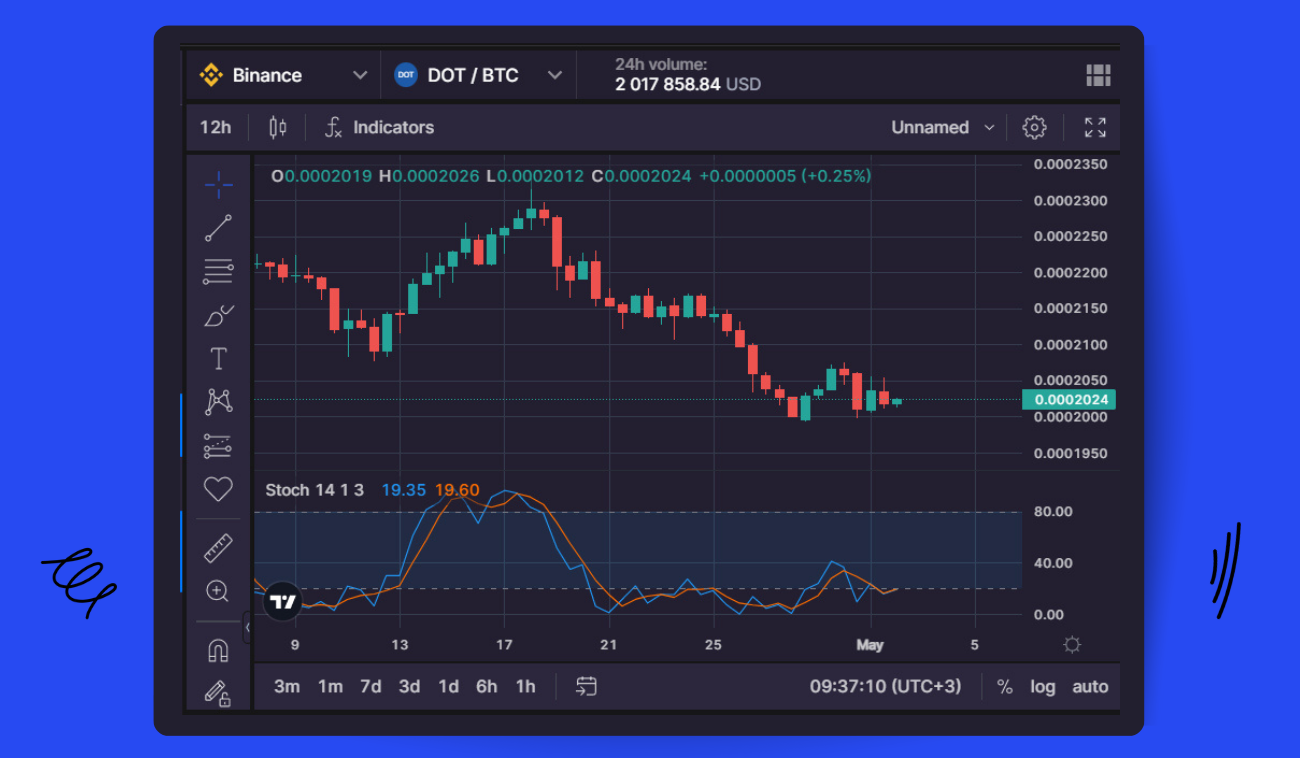
This indicator works for any asset, but it's especially useful for volatile markets like cryptocurrency. Even when price swings are wide, the stochastic cuts through the noise to determine if bulls or bears have the upper hand at the moment.
The stochastic oscillator moves between 0 and 100. Readings over 80 signal overbought conditions — the buying frenzy has likely gone too far, and a pullback may be imminent. Readings under 20 indicate oversold conditions — the panic selling may have been overdone, and a bounce could be on the horizon.
The stochastic is a leading indicator, meaning it can signal changes in price momentum before the trend itself actually turns. Lagging indicators like Moving Averages, on the other hand, simply report what prices have already done. They follow the trend rather than anticipate reversals.
For the clearest picture, analysts will often use the stochastic oscillator along with lagging indicators. The stochastic helps determine entry and exit points based on momentum, while the lagging indicators define the overall trend. Together, they provide a powerful system for navigating the ever-changing crypto market.
Bitsgap’s Crypto Market Analysis Tools
For crypto traders looking to up their technical analysis game, Bitsgap offers an array of advanced tools to analyze crypto charts, spot trading signals, and make price predictions across exchanges.
Bitsgap provides a robust yet customizable trading platform where you can monitor the crypto market, execute trades, and refine your technical skills. Whether you're a beginner learning how to spot basic patterns or an expert customizing your crypto trading bots, Bitsgap has what you need.
New to crypto technical analysis? Bitsgap allows you to draw trend lines, study indicators, and learn at your own pace using demo accounts that simulate live trading without any real risk. Test your ability to generate and act on trading signals before putting real capital on the line. Once you've mastered the basics, Bitsgap's platform can become as advanced as you need it to be.
Ready to get your hands on some pro crypto technical analysis tools on Bitsgap?
Here’s a brief rundown of Bitsgap’s cool tech features, with suggestions for further reading:
- Charting instruments on the [Trading] tab with ability to choose time frames, indicators, and draw sophisticated shapes on chart should you feel creative.
- The Technicals Widget that combines signals from dozens of crypto trading indicators to give an overall market signal to buy or sell. An amazingly powerful and helpful tool that comes with the Advanced Technicals boost that lets you examine each indicator signal separately. Learn more about Technicals here.
- The DCA crypto trading bot that can follow indicators to enter/exit trades for more precise trading. Learn more about DCA here and here.
All in all, Bitsgap offers powerful crypto technical analysis and trading tools for manual or automated trading, with the flexibility to adapt the platform to your unique style.
So, you’re more than welcome to check it out and sign up for a seven-day free trial now!
How to Learn Technical Analysis for Crypto Trading
Learning technical analysis for cryptocurrency trading can be a challenging yet rewarding experience. Here are some tips to help you get started:
- Begin by learning the fundamentals of technical analysis, including chart patterns and technical indicators. This will provide you with the foundation required to apply these concepts to cryptocurrency trading.
- Look for information on crypto market analysis from reputable sources such as books, online courses, and trading forums.
- Practice with a demo account. Bitsgap has demo modes for both the spot and futures markets, allowing you to practice technical analysis without risking real money. This is an excellent way to gain experience and test your strategies before applying them in the live market.
- Join a community of traders where you can share ideas, ask questions, and get feedback from experienced traders. Bitsgap has plenty of social media channels where you can not only chat with fellow traders but also seek advice, learn about platform trading, and participate in competitions.
- Keep learning, attend webinars, read books and articles, and stay up to date with the latest news in the cryptocurrency market.
Bottom Line: Charting the Crypto Uncharted
The good news is technical analysis isn't just useful for generating "buy" signals. It actually helps you assess whether crypto seems to be keeping up with the overall market or starting to lag behind. This type of macro insight is key for any trader who wants to avoid being stuck holding the bag when the music stops.
While beginners may rely entirely on whatever free charting tools they can lay their hands on, professional traders know that's not enough to thrive in volatile markets. They combine technical analysis with research on fundamentals, market cycles, and risk management.
The truth is, mastery as a trader takes work. The real "magic" of technical analysis is using it as one tool among many to gain an edge. Are you up for the challenge?
Whether you're focused on short-term crypto trading signals, improving your chart-reading skills, or building automated trading systems, Bitsgap provides the infrastructure you need.
Bitsgap’s robust yet intuitive platform supports manual and algorithmic trading across exchanges with demo and live accounts. For crypto traders looking to take their technical and market analysis to the next level, Bitsgap has crafted an ideal environment to learn and evolve, using a simple interface that can adapt to increasingly advanced needs. Check it out for yourself!
FAQs
Is Tech Analysis Effective in Cryptocurrency Trading?
Crypto technical analysis can be an effective tool for trading cryptocurrencies, but its reliability can vary depending on market conditions and the trader's level of experience.
While some traders rely heavily on technical indicators and charts for crypto price prediction and market analysis, others believe that fundamental analysis is equally important.
It's essential to note that during unexpected market news or events, technical analysis alone may prove ineffective. So, relying solely on crypto trading signals in these situations may lead to losses.
Therefore, it's important to understand the limitations of crypto technical analysis and use it in conjunction with other analytical tools to make informed trading decisions.
Why Technical Analysis May Fail
Technical analysis relies entirely on historical price trends and patterns. While these trends often rhyme, they might not always repeat. Unexpected events can disrupt trends and trigger volatility spikes that technical tools are ill-equipped to handle.
Technical tools are best applied when markets are efficiently processing all available information and investor emotions are relatively stable. When an unpredicted crisis hits, panic and chaos reign, emotions run wild, and prices move in a disorderly fashion. In these situations, technical analysis alone may fail spectacularly.
That’s why technical analysis should not be used in isolation or as the sole basis for any trading decision. The flaws of any one method can be offset by incorporating additional forms of research and maintaining prudent risk controls. No trader should ever place all their capital on the line based on a single technical indicator or price pattern. A backup plan is essential for those times when trends break down and fail without warning.
What’s the Best Crypto Technical Analysis Book?
There are several well-regarded books on the topic that you may find useful, including "Crypto Technical Analysis: The Complete Guide" by Richard Olsen and "Technical Analysis of Cryptocurrencies: Cryptocurrency Trading Techniques for Beginners" by Sean Bennett. We recommend you review the contents of each book and choose the one that best suits your level of experience and learning style.
Why Is Technical Analysis Important?
Technical analysis empowers you to view your crypto investments with an objective lens. It enables you to detach yourself from emotional bias and perceive the true market dynamics at play. Embracing technical analysis can thus be a valuable learning experience that allows you to make informed investment decisions that are grounded in data and analysis.