Crypto Backtesting Guide 2025: Tools, Tips, and How Bitsgap Helps
In 2025, trading crypto without backtesting is like flying blind. Top-performing traders are using data, not guesswork. Learn how to backtest trading strategies, avoid costly mistakes, and use tools like Bitsgap to simulate, optimize, and launch smarter algo trading bots.
The cryptocurrency landscape has evolved dramatically, with institutional adoption driving more sophisticated market behaviors and increased competition. In this environment, trading on instinct alone is like navigating a storm without instruments.
Rigorous backtesting isn’t just for quantitative hedge funds anymore. According to recent research, crypto strategies that undergo structured backtesting have shown annualized excess returns of up to 8.76%, demonstrating the real-world impact of this practice. Across the industry, a growing body of academic and applied research—spanning over 140 studies—confirms that backtesting is now a standard among top-performing algo trading systems.
What’s driving this shift? Simple: backtesting enables traders to simulate how a strategy would have performed under historical market conditions, allowing them to identify weaknesses, fine-tune parameters, and reduce the risk of live trading failure. In a market known for sudden swings and unpredictable catalysts, this kind of preparation isn't a luxury—it’s a necessity for survival in 2025's complex markets.
This comprehensive guide will walk you through everything you need to know about crypto backtesting:
- What crypto backtesting is and how it works—from historical data to simulation
- How to backtest effectively—including how to read results, set parameters, and avoid common traps
- How Bitsgap helps—with user-friendly tools that bring institutional-grade backtesting capabilities to individual traders
What Is Crypto Backtesting and How Does It Work?
If you’ve ever wondered whether a trading strategy is actually worth using, backtesting is how you find out. Before you put real money on the line, backtesting lets you test your strategy using historical market data to see how it would have performed. It's a core part of smart, risk-aware crypto trading.
A Simple Definition of Backtesting
So, what is backtesting in trading? In simple terms, backtesting is the process of applying a trading strategy to past market data to evaluate its effectiveness. Instead of guessing whether a strategy might work, traders use backtesting to get measurable insights based on real, historical performance.
If a strategy performs well during backtesting, it suggests that the logic behind it could hold up in live markets. If not, it can be tweaked—or tossed—before any real losses occur.
How the Process Works
If you're wondering how to backtest a trading strategy, the core process follows a simple structure:
- Historical data: First, you need access to high-quality historical data. This includes price movements, volume, order book info, and even indicators over a specific time period. The more accurate and detailed the data, the more reliable your backtest results will be.
- Define the strategy: Next, you set the rules for your strategy. This could involve entry and exit signals, stop-loss and take-profit levels, indicators (like RSI, MACD, Bollinger Bands), and risk management settings. Your strategy can be simple or complex, but it needs clearly defined logic that can be applied consistently across historical data.
- Run the simulation” Once your data and strategy are set, the backtesting software simulates trades as if your strategy had been running in the past. This is how backtesting works—it calculates profit/loss, win rates, drawdowns, and more based on how your rules would have played out historically.
The outcome? You get a full performance report that tells you whether your strategy is viable—or needs work.
Examples: What Parameters to Set, What Pairs and Timeframes to Choose
Let’s say you want to backtest a simple moving average crossover strategy on BTC/USDT. Here’s what you might define:
- Trading Pair: BTC/USDT
- Timeframe: 1-hour candles over the last 6 months
- Entry Rule: Buy when the 50 MA crosses above the 200 MA
- Exit Rule: Sell when the 50 MA crosses below the 200 MA
- Stop-Loss: 3%
- Take-Profit: 6%
Other common parameters you can experiment with include leverage, trailing stops, and fees. You can also try different timeframes—from minute-by-minute scalping to weekly swing strategies—and apply your strategy to different pairs to see where it performs best.
The goal is to find not just a strategy that "wins," but one that performs consistently across various conditions.
How to Backtest a Crypto Strategy to Build Profitable Systems
Backtesting a crypto strategy isn't just about seeing if it would have worked in the past—it's about shaping it into something resilient enough for real market conditions. When done right, backtesting becomes your strategy lab: it filters out weak setups, validates good ideas, and helps you uncover hidden strengths or flaws. It lets you test, tweak, and optimize your trading logic using real historical data, so your crypto strategy is built on evidence—not guesswork.
How to Filter Out Bad Settings with Backtests
One of the most important functions of backtesting is filtering out poor-performing configurations before they ever reach the live market. Many strategies fail not because the core idea is flawed, but because key parameters—such as stop-loss thresholds, indicator periods, or risk allocation—aren’t properly aligned with market behavior.
Backtesting allows you to systematically test different combinations of:
- Entry and exit criteria
- Timeframes (e.g., 5-minute, 1-hour, daily)
- Technical indicators (e.g., RSI thresholds, moving average lengths)
- Risk settings (e.g., position sizing, stop-loss and take-profit levels)
- Market conditions (bull, bear, ranging)
By comparing results across multiple versions of a strategy, you can quickly eliminate settings that produce high drawdowns, excessive trade frequency, or inconsistent returns. This reduces overfitting and helps you zero in on robust, reliable setups.
What to Test
Effective backtesting isn’t about throwing strategies at the wall and seeing what sticks. It’s about thoughtful hypothesis testing. Here are some core elements to consider when designing your backtest:
- Strategy logic: Does your idea have a sound rationale (e.g., trend-following, mean reversion, volatility breakout)?
- Technical indicators: Which indicators drive your signals, and how are they configured?
- Timeframes: Does your strategy perform better on short-term charts or higher timeframes?
- Market types: Test across different conditions: trending, sideways, and high-volatility environments.
- Execution assumptions: Include realistic slippage, fees, and latency if applicable.
- Risk management: Test different stop-loss levels, take-profit ratios, and position sizing rules.
Each of these variables can significantly impact overall performance. A backtest that takes these into account is far more likely to translate into a profitable real-world system.
When Backtesting Is Particularly Useful
Backtesting can be valuable at nearly every stage of the strategy development process—but certain moments stand out where it’s especially useful:
- Validating a new trading idea: Before allocating capital, use a backtest to see if the concept holds up historically.
- Optimizing an existing strategy: Fine-tune parameters and improve efficiency based on past performance.
- Adapting to new market conditions: After major macro or volatility shifts, test whether your current strategy still performs as intended.
- Switching to a new asset or pair: Backtesting helps determine if your strategy is compatible with a different crypto pair or asset class.
- Stress-testing during unusual events: Simulate how your system would have handled black swan events, flash crashes, or periods of extreme volatility.
By using backtesting as both a validation tool and a sandbox for experimentation, traders can significantly reduce the trial-and-error phase and transition into live trading with greater confidence and clarity.
How to Read Backtest Results: Metrics That Matter
Obtaining backtest results is only half the journey; understanding what they mean transforms backtesting from a practice exercise into a powerful tool for decision-making. In other words, a backtest report is rich with metrics and charts that reveal how a strategy performed—and why it performed that way. By analyzing these metrics in detail, you can gauge a strategy’s profitability, risk, and consistency before risking real capital.
Key Metrics to Analyze in Backtest Reports
When you run a backtest, the software will usually output a set of metrics summarizing performance. Here are the core metrics you’ll encounter and what each one reveals about your strategy’s strengths and weaknesses:
- Total Return (Net Profit): This shows the overall gain or loss over the backtest period, usually as a percentage of the starting capital.
📌 Example: A 50% return means your account grew by half its starting value.
⚠️ Caution: A strategy that tripled an account in a year sounds great—but if it nearly crashed with a massive drawdown, those gains may not be repeatable or worth the risk.
- Sharpe Ratio: This measures return per unit of risk (volatility). It tells you how smooth and consistent the strategy’s performance was.
📌 Example: Two strategies both make 20%—but one has a Sharpe of 1.5 and the other 0.5. The higher Sharpe strategy got there with less volatility.
✔️ Aim for: 1.0+ is solid; 2.0+ is strong.
- Maximum Drawdown (Max DD): The largest drop from a peak to a low point during the test—basically, your worst-case loss before a recovery.
📌 Example: A 30% max drawdown means your strategy lost nearly a third of its value at some point.
⚠️ Red flag: Even if the strategy made 100% profit overall, a 50% drawdown suggests dangerously high risk. Look for drawdowns in the single digits or low double digits if possible.
- Win Rate: This is the percentage of trades that ended in profit.
📌 Example: A 55% win rate means 55 out of 100 trades were winners.
⚠️ Context matters: A 95% win rate might sound amazing—but it could mean the strategy grabs small profits while risking big losses. Conversely, a 40% win rate can still be highly profitable if your average win is 3x larger than your average loss.
- Profit Factor: The ratio of total profit to total loss.
📌 Example: A profit factor of 1.5 means for every $1 lost, the strategy earned $1.50.
✔️ Ideal range: 1.5–2.5.
⚠️ Caution: Profit factors over 4.0 can signal overfitting or dependence on a few big trades.
- Number of Trades: The total trades executed during the test period.
📌 Example: A strategy with just 5 trades in a year might show great returns—but that's not statistically meaningful.
✔️ More trades give a clearer, more reliable picture.
⚠️ If most of your profit came from one or two trades, your results might not be repeatable. On the flip side, if your strategy makes hundreds of trades, consider whether fees or slippage could eat into those returns.
Fig. 1. Key backtesting metrics table.
Interpreting Backtest Charts (Equity Curves & Drawdowns)
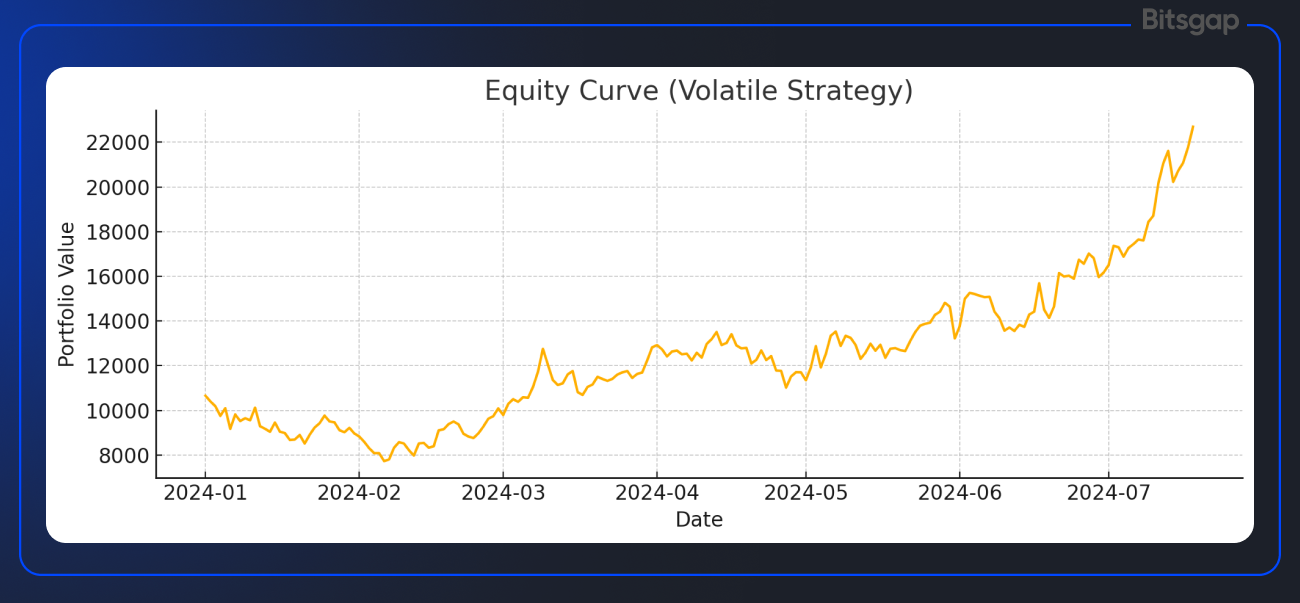
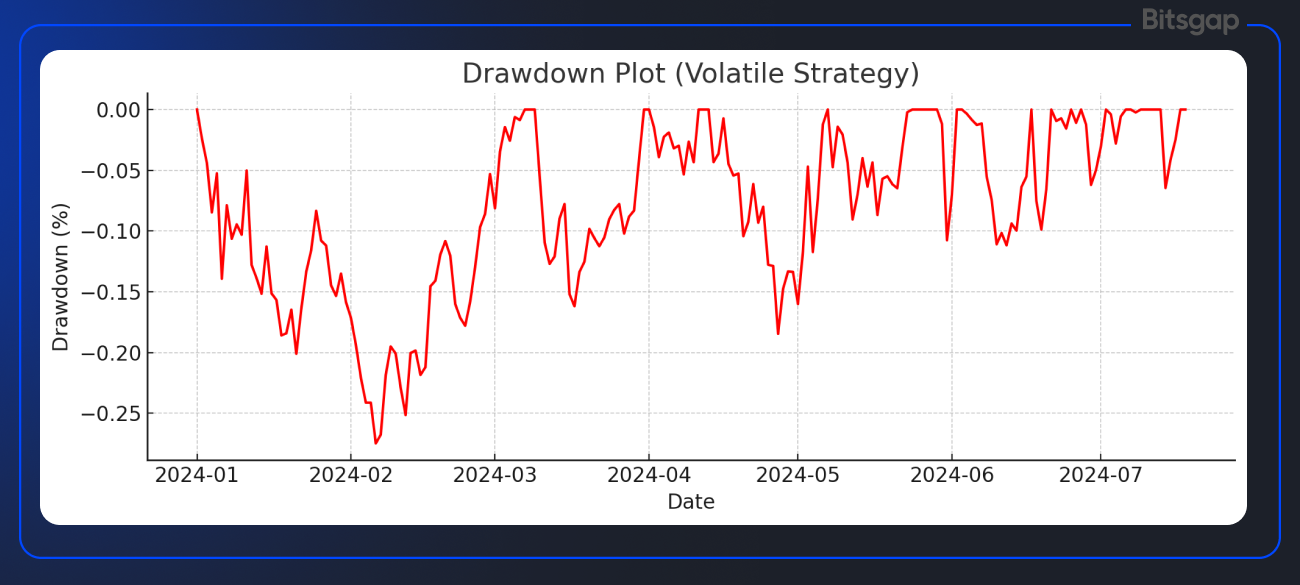
Beyond raw numbers, backtest platforms typically provide visual charts that can help you quickly grasp the performance dynamics of your strategy. The two most important visuals are the equity curve and the drawdown plot, often accompanied by markers showing where trades occurred. Here’s how to read these charts:
- Equity Curve: This line graph shows how your portfolio’s value changed over the backtest period. A smooth, upward-trending curve suggests consistent, stable gains—exactly what you want to see. Mild dips are normal, but large, erratic swings could signal volatility or dependence on a few big trades. A flat curve may mean the strategy had periods of inactivity or breakeven performance. Beware of equity curves that look too perfect; a near-linear rise with no drawdowns often indicates overfitting or unrealistic assumptions.
- Drawdown Plot: Displayed beneath the equity curve, this chart tracks the depth of losses from the portfolio’s most recent peak. A shallow, quickly-recovering drawdown profile points to a resilient strategy, while deep or frequent dips suggest higher risk. Persistent drawdowns—or those that never fully recover—are red flags that the strategy may not hold up under pressure.
- Trade Markers: These markers show where buy and sell decisions occurred during the backtest. Analyzing them helps you understand the strategy’s timing and market conditions. Consistent distribution across different periods is ideal; clustering can reveal sensitivity to specific conditions. Markers that always hit tops and bottoms may indicate look-ahead bias. Also, a dense cluster of trades could suggest a high-frequency strategy, which may not be practical due to fees or slippage.
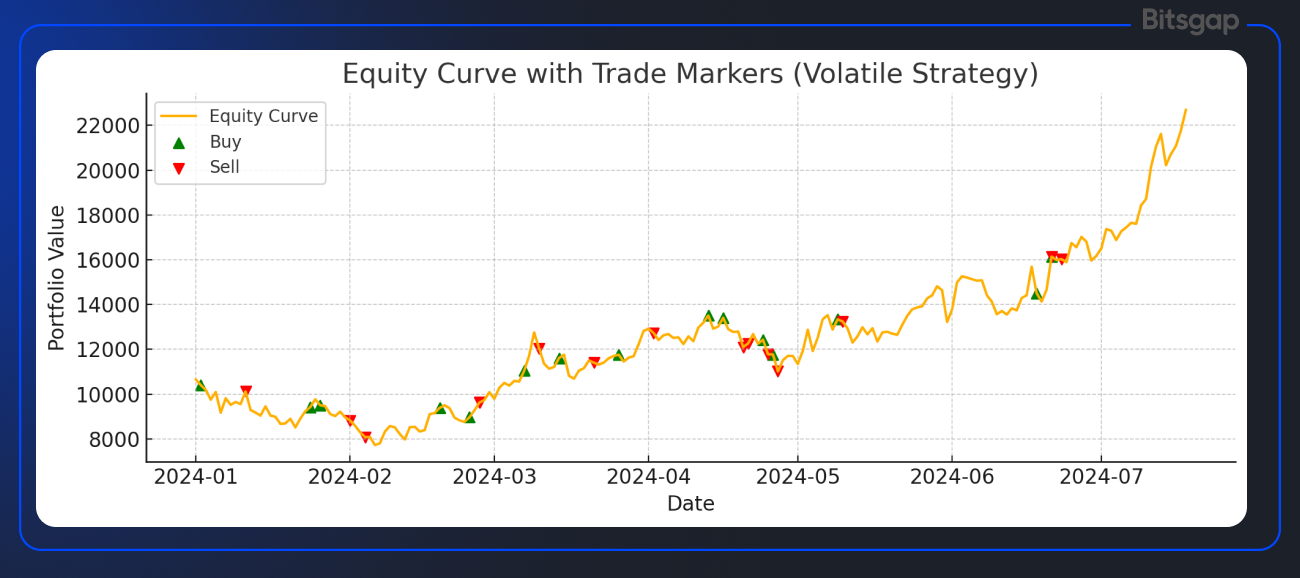
Together, these visuals offer crucial context for the numbers—helping you spot patterns, stress points, and potential issues at a glance.
What Is a “Good” Backtest Result?
After reviewing the metrics and charts, you might ask: what defines a good backtest? While it depends on your risk tolerance and trading goals, strong strategies tend to share a few key traits:
- Steady, Consistent Growth: Look for an equity curve with a smooth, upward slope and only mild, short-lived dips. This suggests the strategy delivers reliable gains across different market conditions, not just during one lucky stretch. Consistency often reflects balanced trade outcomes and manageable volatility.
- Controlled Risk:Solid returns should come with reasonable drawdowns. For example, a 20% return with only a 5% drawdown is far more attractive than the same return with 30% risk. Favorable backtests typically show a healthy Sharpe ratio (1.0+), a solid profit factor (above ~1.5), and tolerable losses—results you’d realistically be comfortable with in live trading.
- Sufficient Sample Size & Robustness:A strong backtest includes a meaningful number of trades, reducing the odds that results are due to chance. Even better if the strategy performs consistently across different timeframes, assets, or market phases. Robust strategies hold up under variation, not just in one tightly defined scenario.
Fig. 2. What makes a good backtest result.
Finally, gut check the results: Are they realistic? A strategy that turns $10,000 into $1,000,000 in one year with minimal downside in a backtest is probably too good to be true. A “good” result is one that excites you but also makes sense in context of how markets behave—typically moderate, steady profits with manageable risk, rather than extreme outcomes.
Red Flags: When to Recalculate or Rework the Strategy
A strong backtest typically shows a steadily rising equity curve, manageable drawdowns, and enough trades to be statistically reliable. But if the results look too good—like a perfectly smooth curve or sky-high returns with minimal risk—it’s time to be skeptical. These signs often point to overfitting or unrealistic assumptions that won’t hold up in live markets. Similarly, strategies that only perform under very specific conditions (e.g., only on one timeframe or coin) lack robustness.
Here are key red flags to watch for:
- Extreme Drawdowns: If the backtest shows deep drawdowns (e.g., 30–40% or more), it signals high risk and potential for failure in real trading. Large losses can be hard to recover from and may indicate poor risk management or an unstable strategy. Rework or tighten risk controls if you see this.
- Unrealistic Win Rate or Returns: A 90%+ win rate or equity curve with no dips usually means something’s off—like look-ahead bias, over-optimization, or ignoring real-world factors like slippage and fees. If it looks too good to be true, it probably is.
- Inconsistent Performance: If the strategy only works in one market condition or timeframe and breaks down elsewhere, it’s likely overfit. A good strategy should hold up across different environments. Big performance swings from small changes in inputs are also red flags.
- Overfit Metrics: Metrics like a Sharpe ratio above 4 or profit factor above 5—especially with few trades—suggest the strategy may be tailored too closely to the past. Consider simplifying the logic and using techniques like forward testing or cross-validation.
- Sensitivity to Parameter Changes: If slight tweaks to indicators or thresholds cause dramatic drops in performance, the strategy likely isn’t robust. A solid system should show reasonably stable results across a range of settings.
In summary, always approach backtest results with a critical eye. Look for a combination of good returns and controlled risk, and be skeptical of anything that looks overly rosy. If you spot any of the red flags above, it may be necessary to recalculate the backtest with corrections (e.g. include realistic transaction costs, fix any data leaks) or to go back to the drawing board with your strategy concept. The goal is to ensure your backtest paints an accurate and honest picture of how your strategy might perform, so that you can trade with confidence in the real world, armed with strategies that are truly ready for the challenge.
Backtest vs Demo Mode: When to Use Each?
While both backtesting and demo mode are essential tools for strategy development, they serve different purposes—and knowing when to use each can make your trading process far more effective. Backtesting gives you a data-driven look into past performance, while demo trading simulates live market conditions. Used together, they provide a powerful one-two punch for validating and fine-tuning your approach.
What Is Demo Mode—and How Is It Different from Backtesting?
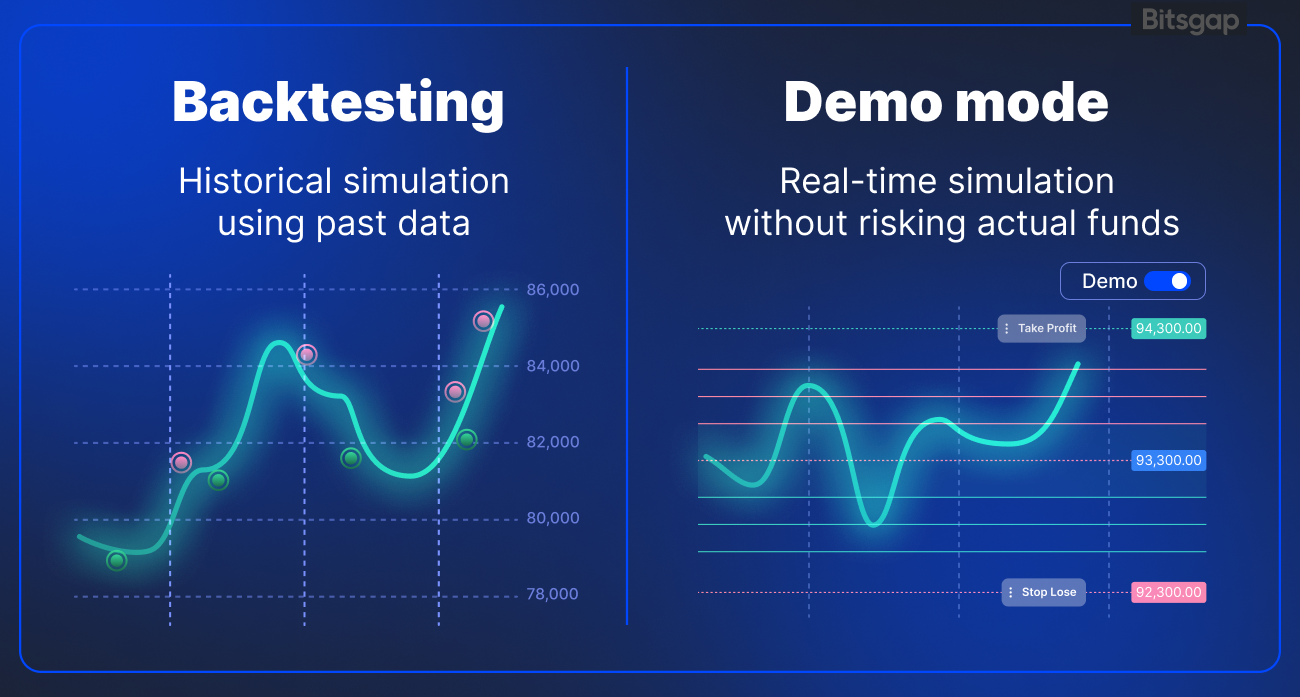
- Demo mode (also called paper trading or simulated trading) allows you to run your strategy in real time using live market data, but without risking real capital. It mimics actual execution, showing you how your system behaves in current market conditions—including order placement, slippage, and spread behavior.
- Backtesting, by contrast, is a historical simulation. It applies your strategy to past market data to see how it would have performed under previous conditions. It’s faster, more controlled, and lets you run hundreds of tests in a short period—but it doesn’t account for live-market quirks like latency or real-time volatility spikes.
Benefits of Backtesting
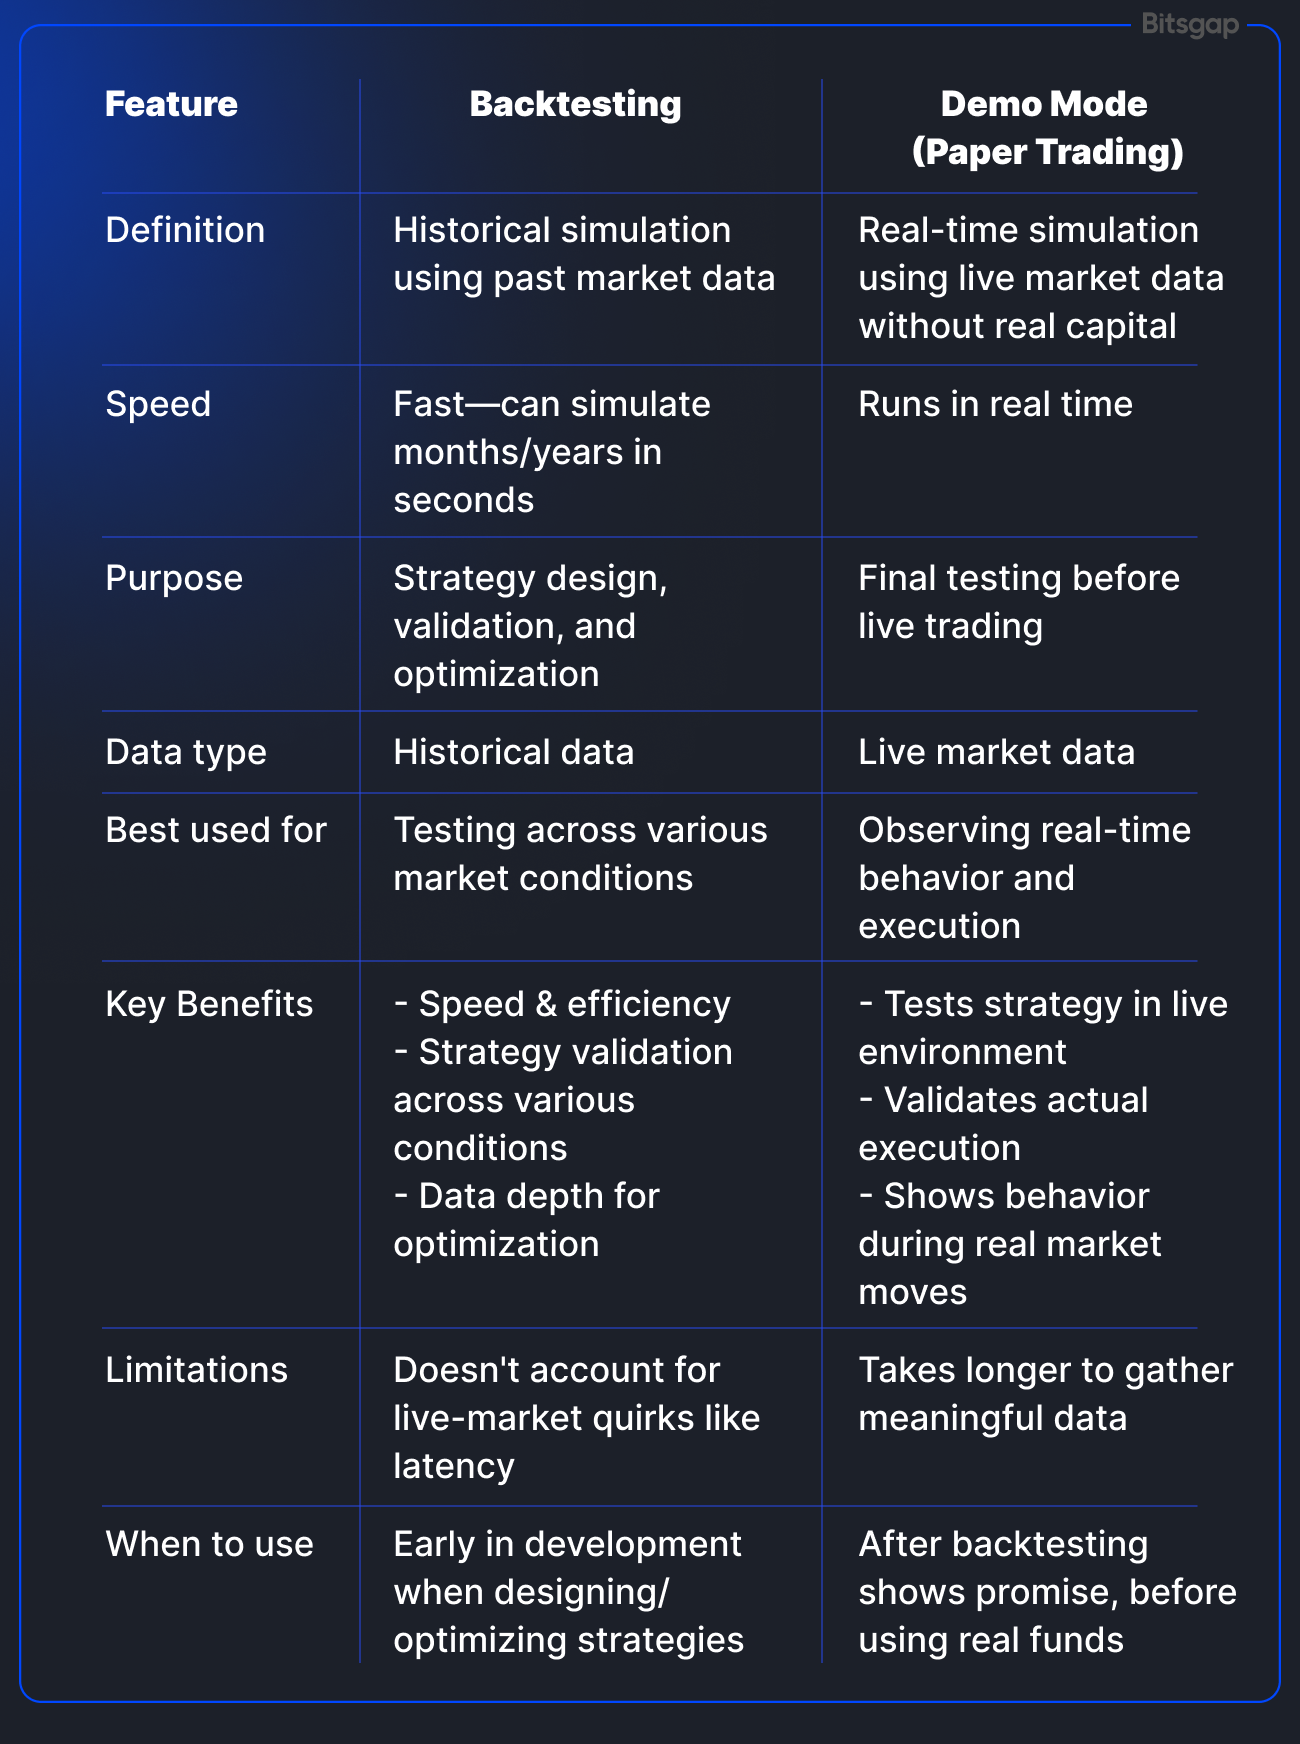
- Speed & Efficiency: Backtesting is fast. You can simulate weeks, months, or years of trading in seconds.
- Strategy Validation: It allows you to test ideas across various market conditions—bullish, bearish, sideways—without waiting.
- Data Depth: You can experiment with many combinations of indicators, timeframes, and settings to optimize your strategy before ever going live.
Backtesting is best used when you’re designing or optimizing a strategy and want to understand how it behaves across historical scenarios.
When to Use Demo Mode
Once you’ve got a promising strategy from backtesting, demo trading is the next step. It helps answer the real-world questions:
- Does the strategy hold up in a live environment?
- Are trades executed as expected?
- Does it behave well during sudden market moves or low-liquidity periods?
Use demo mode to observe behavior in real time—to see how your strategy interacts with real order books, responds to volatility, and fits within your risk comfort zone. It’s the ideal final filter before risking real funds.
Why Bitsgap Backtesting Platform Stands Out
As automated crypto trading gains popularity, the need for accessible yet powerful backtesting solutions has never been greater.
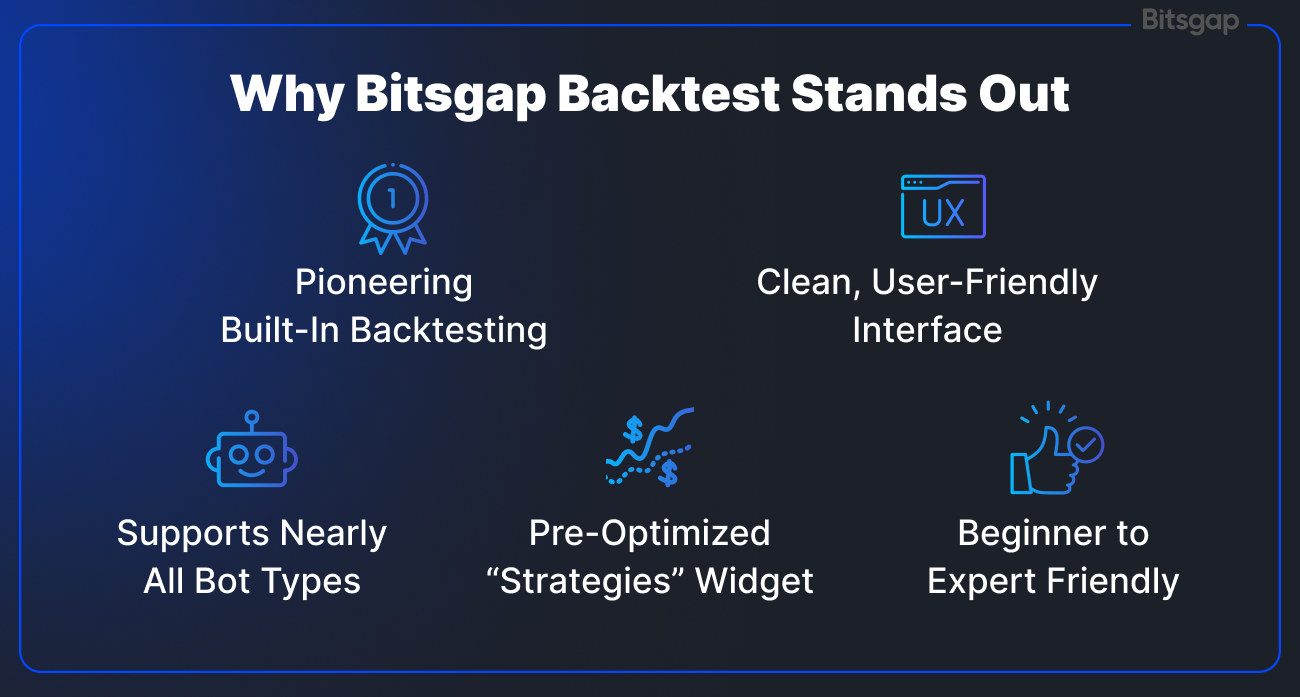
Bitsgap addresses this demand head-on. It offers an integrated backtesting feature for its crypto trading bots that truly stands out from the crowd. Here’s why Bitsgap’s backtesting is exceptional:
- Pioneering Built-In Backtesting: Bitsgap was among the first platforms to offer built-in backtesting for crypto trading bots. This standout feature lets you simulate your bot strategy on historical market data directly within the platform, so you can vet a setup before committing any real fund. By being early to integrate backtesting into its toolkit, Bitsgap set the trend for making strategy testing a seamless part of bot configuration. Unlike competitors who charge extra for this essential feature, Bitsgap provides comprehensive backtesting completely free with all plans upon registration. The tool is available out of the box to all users, regardless of subscription level, giving you the advantage of thorough strategy validation without additional costs.
- Clean, User‑Friendly Interface: The backtesting tool is designed with Bitsgap’s signature clean interface and intuitive charts. All the controls—from setting price ranges to viewing simulated trades—are clearly laid out. This means even if you’re not a technical expert, you can quickly understand results and adjust your strategy with confidence. The interface visualizes your bot’s hypothetical trades on the price chart, making it simple to see how the strategy would play out.
- Supports Numerous Strategies (Nearly Every Bot): Flexibility is key, and Bitsgap’s backtester works with almost all its automated bots. Whether you’re optimizing a GRID bot for sideways markets or a DCA bot for volatility, you can backtest it. In fact, every Bitsgap bot strategy can be backtested except the new LOOP bot. This broad support means you have one unified tool to test GRID, DCA, COMBO, and BTD across different market conditions. Few platforms offer such wide strategy coverage under one roof.
- “Strategies” Widget with Pre-Optimized Setups: Bitsgap makes backtesting even more beginner-friendly with its built-in Strategies widget. This widget suggests a list of pre-configured bot strategies that have already been optimized and backtested, each ranked by past profitability. In other words, Bitsgap combs through historical data to find high-performing parameter combinations—and presents them to you as ready-to-run options. You can launch these proven strategies as-is with a couple of clicks, or use them as a starting point and tweak the settings further to suit your preferences. It’s a huge time-saver for those who want results quickly, acting like a “shortcut” to profitable bot setups.
- Suitable for All Skill Levels: One of Bitsgap’s strengths is that it caters to both newcomers and seasoned traders. For beginners, the backtesting feature (combined with demo mode and the strategy presets) provides a safe sandbox to learn and validate strategies without confusion—the interface guides you through each step, and you don’t need advanced skills to interpret the results. Meanwhile, advanced users appreciate the depth: they can fine-tune every parameter and test complex strategy variations to maximize returns. Even passive investors who prefer a hands-off approach benefit from backtesting—they can verify an automated strategy’s track record over past months before trusting it with real funds, which adds an extra layer of assurance. In summary, whether you’re a crypto novice or a pro, Bitsgap’s backtesting adds value by boosting your confidence in any bot you launch.
How to Use Bitsgap’s Backtesting
Using Bitsgap’s backtesting feature is straightforward and integrated into the bot setup process. Here are the simple steps to run a backtest and optimize your bot settings:
- Open the Bot Settings: First, go to the Bitsgap trading bot interface and start configuring a new bot. The Backtest tool is easily accessible in the bot’s launch settings menu—you’ll see a [Backtest] button once you’ve entered your bot parameters.
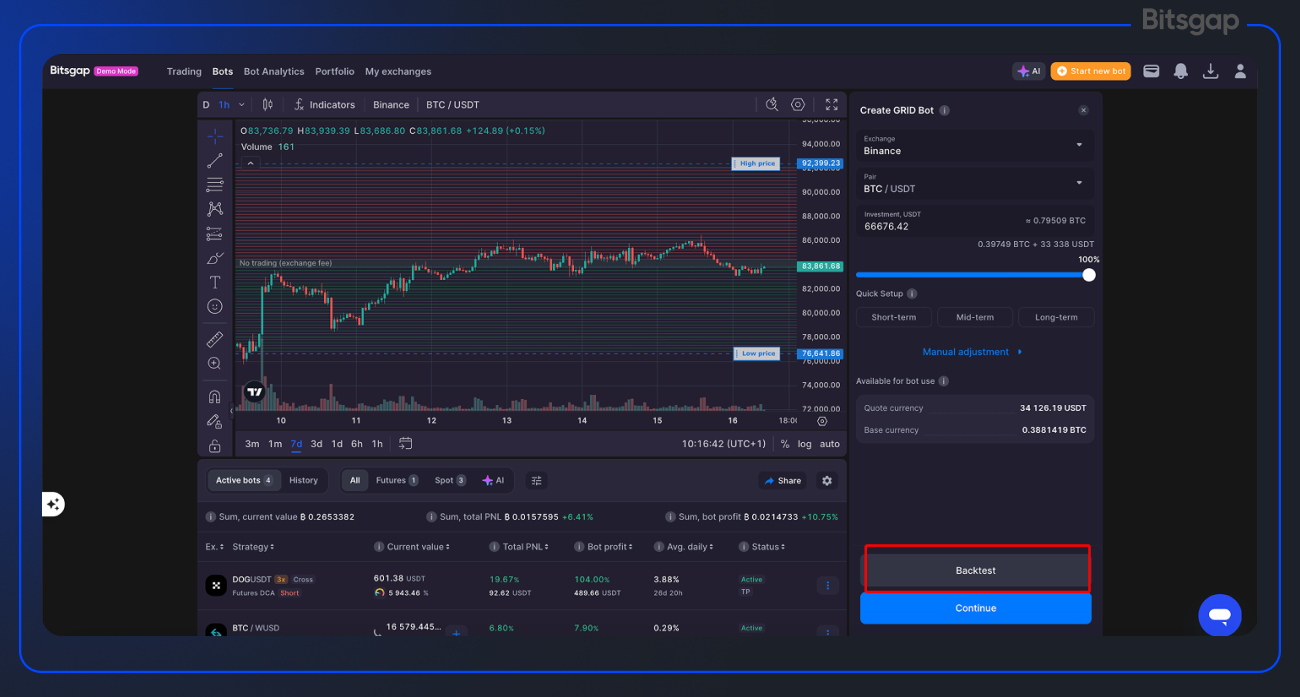
- Configure and Run the Backtest: Choose your trading pair and set up the bot’s parameters (for example, define your grid price range, number of grid levels, investment amount, etc.). After configuring these settings, simply click the [Backtest] button to run a simulation. Bitsgap will then instantly analyze how your configured bot would have performed over a past period, and it will display the simulated profit/loss, number of trades, and other performance metrics in a popup report. This lets you see at a glance whether the strategy would have been profitable.
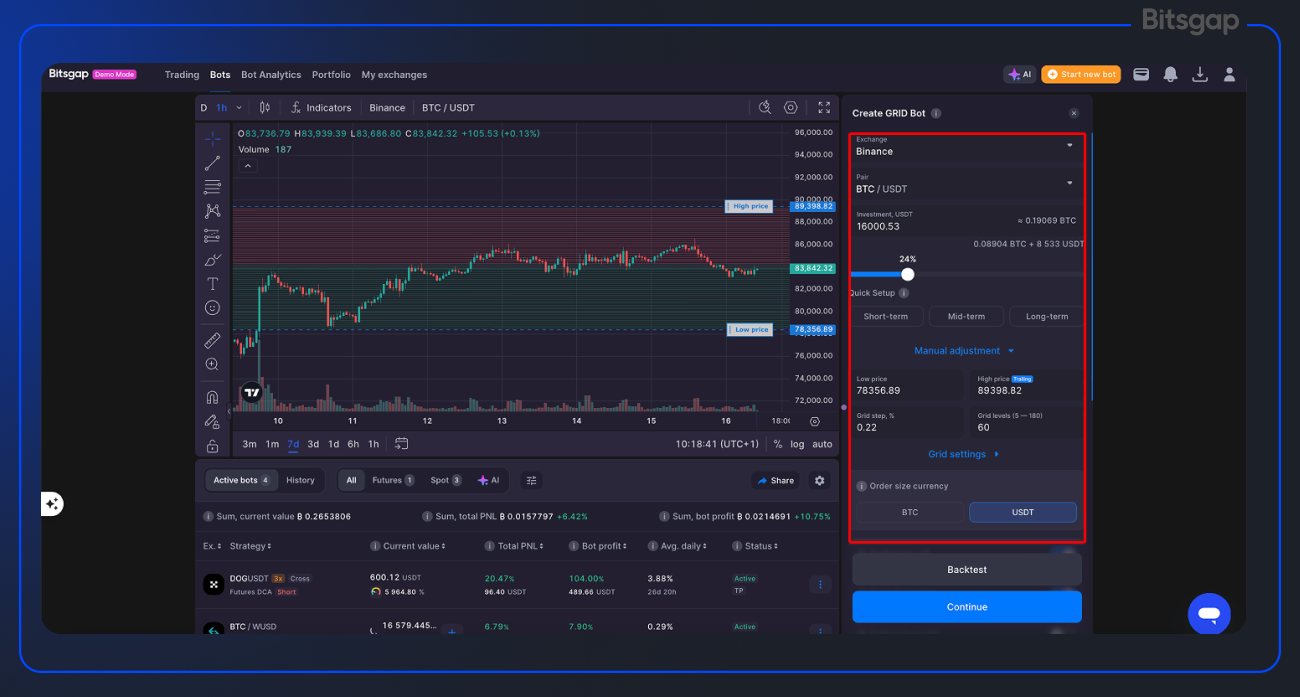
Pic. 2. Tweaking your bot’s parameters before running backtest.
- Select a Timeframe: You’re not limited to a one-size-fits-all test period. Bitsgap allows you to adjust the backtest period using a built-in calendar tool. By default, users can backtest using up to the last 30 days of historical data. Recently, Bitsgap expanded this range—those on higher-tier plans can now test with even longer history snapshots (such as 3 months, 6 months, or 1 full year of data) for a more thorough analysis. You can select any custom date range within your allowed limit. For example, you might run a 14-day backtest to see short-term performance, or extend to 60 or 180 days if available on your plan to understand longer-term behavior. Simply pick the start and end dates in the calendar, and the system will recalculate the simulation for that period.
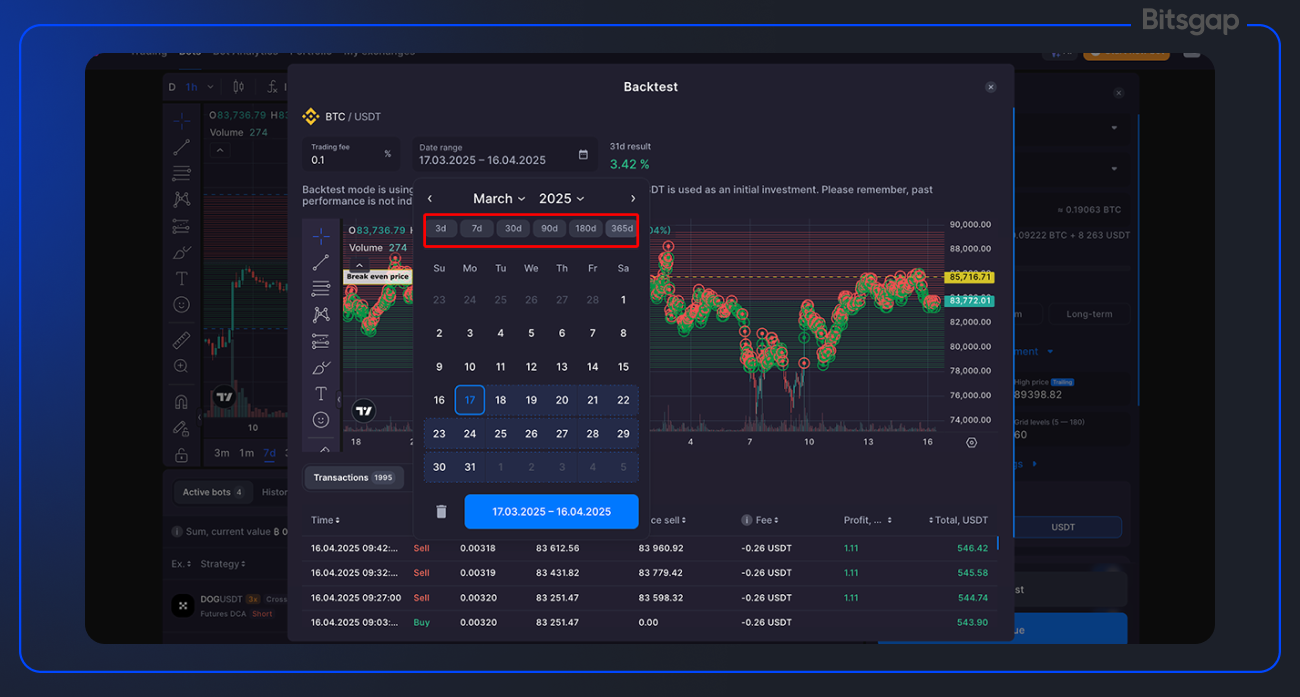
- Refine and Re-test: After the backtest completes, review the results. Bitsgap’s report will show you key metrics like total simulated return, average daily percent profit, and so on. If the outcome isn’t satisfactory, you can go back and adjust your bot’s settings to try a different approach. Common tweaks include changing the price range, altering the number of grid levels, or modifying the investment per order. Once you’ve made an adjustment, hit Backtest again to see how the new settings would perform. This iterative process of tweaking and re-running the backtest is encouraged—it helps you zero in on the optimal configuration for your goals. With each iteration, you’re essentially asking “What if I did X instead?” and letting the historical data give you an answer. By refining in this way, users can dramatically improve a strategy’s projected results before deploying the bot live.
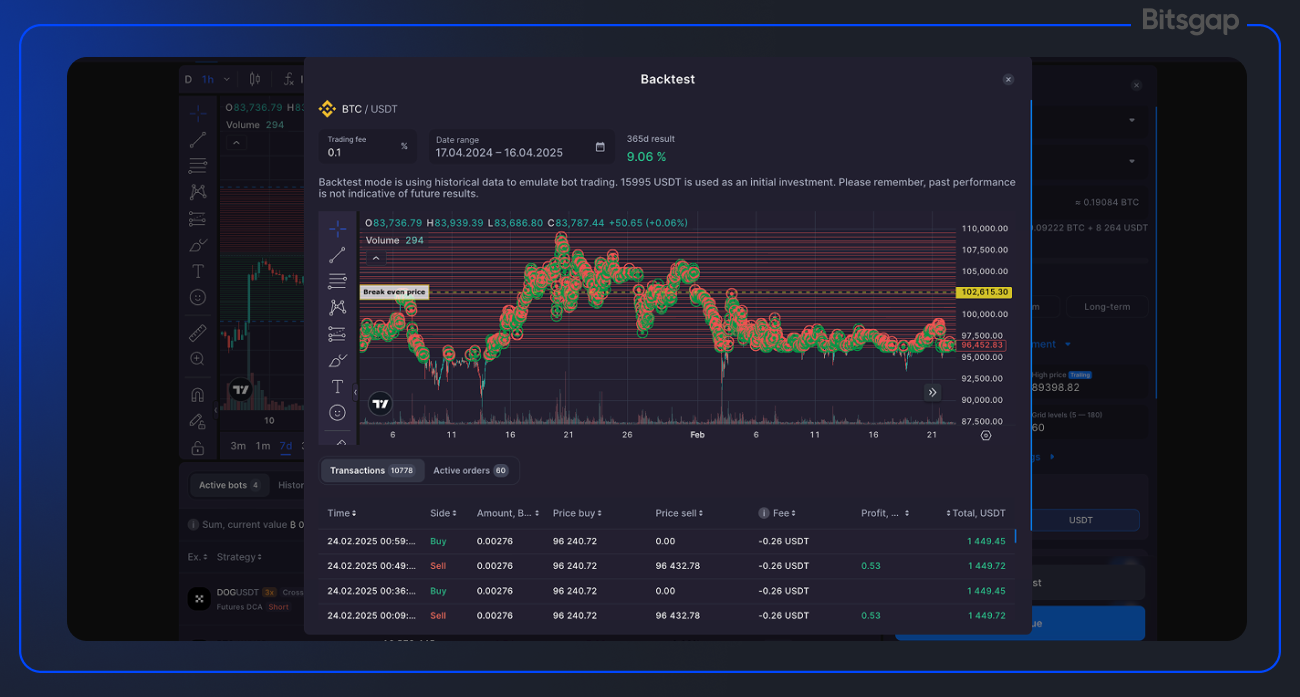
Bitsgap Backtest Example
Let’s say you’re building a BTC/USDT GRID trading bot. You configure it with 20 grid levels, a price range between $25,000 and $30,000, and an investment of $1,000. Using Bitsgap’s backtest tool, you simulate how this exact setup would’ve performed over the past 30 days.
- You discover that while the bot earned 6.2% during sideways price action, it struggled when BTC spiked out of range.
- You go back, widen the grid range, reduce grid density slightly, and test again.
- This time, the bot earns 5.4%—slightly lower returns, but with much lower drawdown and fewer missed trades.
By iterating and retesting, you move closer to a profitable system with a real-world edge—one that matches your risk tolerance and adapts to different market scenarios. That’s the power of backtesting a crypto strategy effectively.
Is Bitsgap Backtest Accurate?
Yes—Bitsgap’s backtesting is accurate within the limits of historical data and the assumptions used in the simulation. It uses real market data to evaluate how a trading bot would have performed over a selected period, helping you estimate profitability, risk, and trade frequency.
However, like all backtesting tools, it does not account for live market factors such as latency, slippage, or sudden liquidity shifts. While the results are a strong indicator of how a strategy might behave, they’re not a guarantee of future performance.
Conclusion: Smarter Trading Starts with Testing
In 2025’s highly dynamic crypto market, trading without a backtest is like driving without brakes—risky, reckless, and bound to end badly. As strategies become more automated and competition intensifies, backtesting has become the essential first step to trading with precision and confidence.
Whether you're refining a high-frequency setup or testing a long-term investment model, backtesting trading strategies helps you uncover what works and what doesn't—before any capital is on the line. It empowers you to analyze risk, optimize parameters, and build a strategy you can trust. In short, smarter trading starts with testing.
That’s where Bitsgap stands out. With intuitive tools, a powerful backtesting software engine, and support for nearly every bot strategy (except LOOP), Bitsgap allows you to simulate, refine, and launch your bots with confidence. You can even explore the backtest portfolio of top-ranked strategies through the built-in Strategies widget—perfect for beginners and pros alike.
Ready to take control of your trading outcomes?
Try the backtest feature on Bitsgap right now—and turn your strategy into a smarter, data-driven plan.
