Ichimoku Cloud Trading Tips for Crypto
Dive into the misty recesses of cryptocurrency trading with the Ichimoku Cloud — a powerful, yet underexplored strategy. Unravel the secrets of this intricate tool, learn to fine-tune its settings for optimal results, and discover real-life examples.
Historically, the Ichimoku Cloud indicator has been a stellar performer in identifying pivotal trend reversals. This piece will delve into its configuration nuances and practical application.
Imbued with a unique and somewhat elusive moniker, the Ichimoku Cloud is often perceived as one of the most intricate indicators in the realm of technical analysis. Its intricacy is not simply attributed to its distinctive name. Rather, it's because it serves as a veritable treasure trove of data that demands a certain degree of comprehension to decipher its workings. Yet, the fascinating aspect of this complexity is that, with the right knowledge key, it can transform mere indications into golden opportunities for profit.
In the electrifying world of crypto markets, trading with the Ichimoku Cloud has gained considerable popularity. This guide is your lantern in the labyrinth of the Ichimoku Cloud, designed to illuminate its mysteries and reveal when the indicator sends out its siren call to buy or sell.
What Is Ichimoku Cloud Crypto?
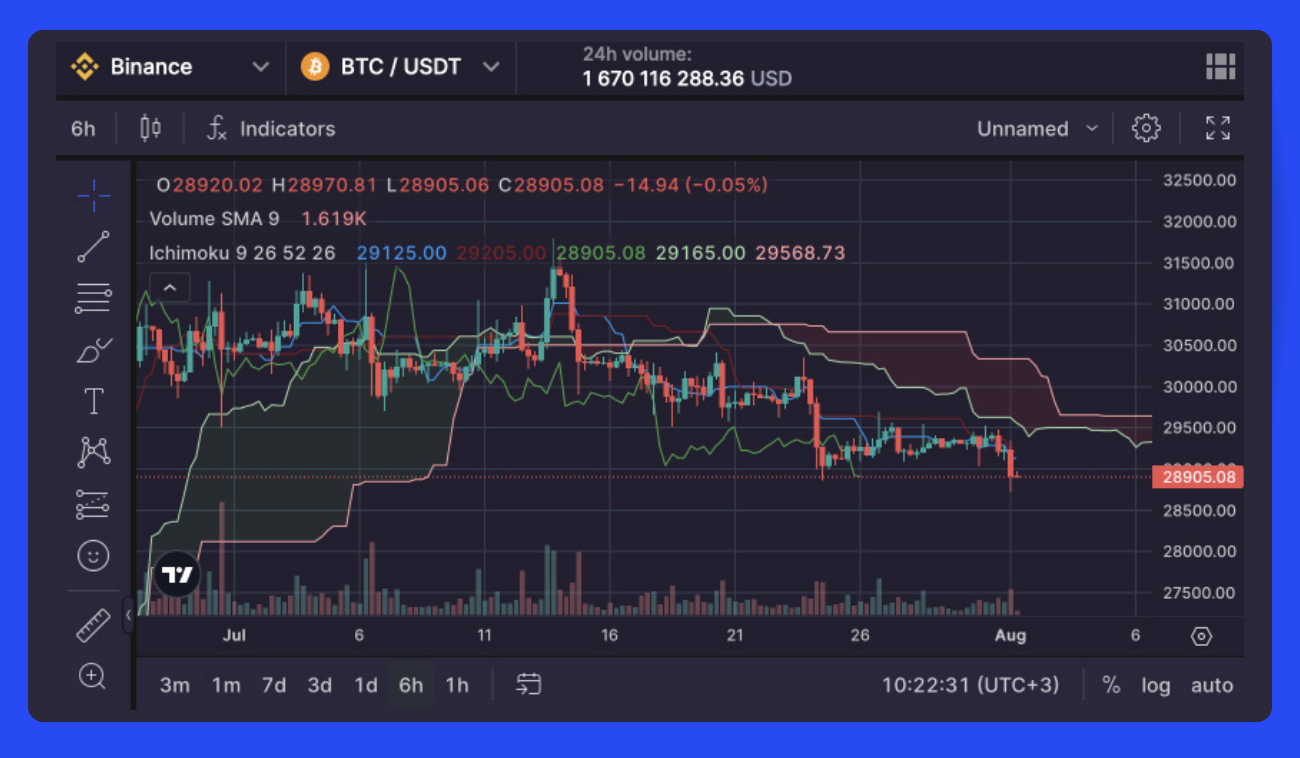
Ichimoku Kinko Hyo, also known simply as Ichimoku, is a comprehensive technical indicator introduced in the 1940s by Japanese journalist Goichi Hosoda. The global trading community frequently refers to it as the "Ichimoku Cloud," a nod to its visual representation on the chart:
👉 The term Ichimoku Kinko Hyo, when translated from Japanese, means 'equilibrium at a glance.' This succinctly encapsulates the core ethos of the strategy: it enables traders to glean a comprehensive understanding of the market dynamics from a single glance at the chart, empowering them to take decisive next steps with confidence.
Functioning as an impulse indicator, Ichimoku evaluates the intensity of price movements. It has earned the prestigious title of a classic indicator, carving a niche for itself in the international trading community.
How Does Ichimoku Cloud Work for Crypto?
Employing a blend of both lagging and leading indicators, the Ichimoku Cloud presents a multifaceted data view. Five primary components, or lines, formulate the charts in the Ichimoku system: the Base Line, Conversion Line, Lagging Span, Leading Span A, and Leading Span B (Pic. 2):
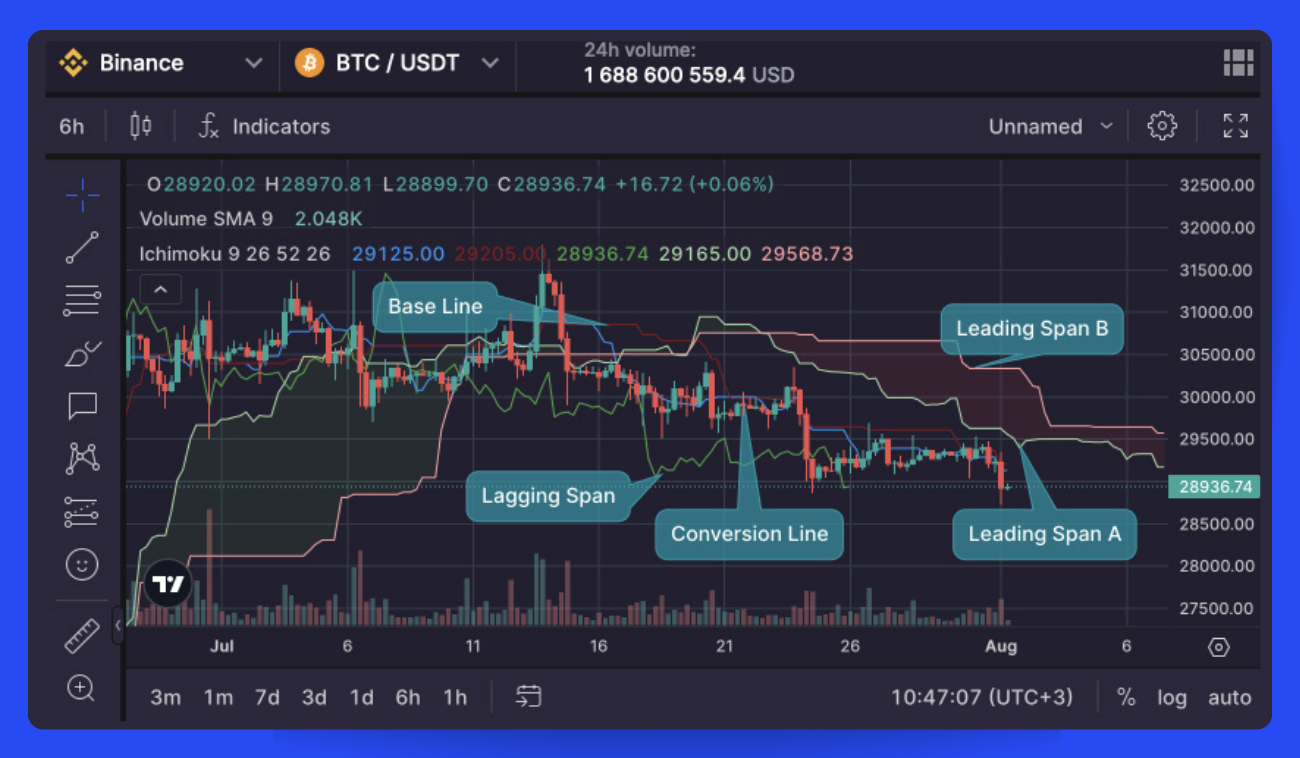
Let’s examine those in more detail below:
Known as the Kijun-sen line, the Base Line represents the midpoint of the preceding 26 candlesticks. It is computed using the following equation:
[(26-period high+26-period low)/2]
The Tenkan-sen line, also referred to as the Conversion Line, signifies the midpoint of the last 9 candlesticks. It is derived via the formula:
[(9-period high+9-period low)/2]
The Chikou Span, or Lagging Span, corresponds to the closing price of the current period. True to its name, the span lags behind the price and is displaced 26 periods back.
The Senkou Span A, otherwise known as Leading Span A, demarcates one of the two cloud boundaries. It represents the midpoint (or moving average) of the baseline and the conversion line, projected 26 periods into the future. It's the faster-moving cloud boundary and is calculated using the formula:
[(conversion line+baseline)/2]
The Senkou Span B, or Leading Span B, forms the second cloud boundary and is the midpoint of the last 52 price bars (or the 52-period moving average). It is derived using the formula:
[(52-period high+52- period low)/2]
This slower cloud boundary is also plotted 26 periods into the future.
Occupying the space between Leading Span A and Leading Span B, the Kumo Cloud (Pic. 3) is the most distinctive element of the Ichimoku system. Given that both Leading Span A and Leading Span B are projected 26 periods into the future, they serve as vital forecasting tools, thereby earning the status of leading indicators. The Lagging Span, which is cast 26 periods into the past, is deemed a lagging indicator.
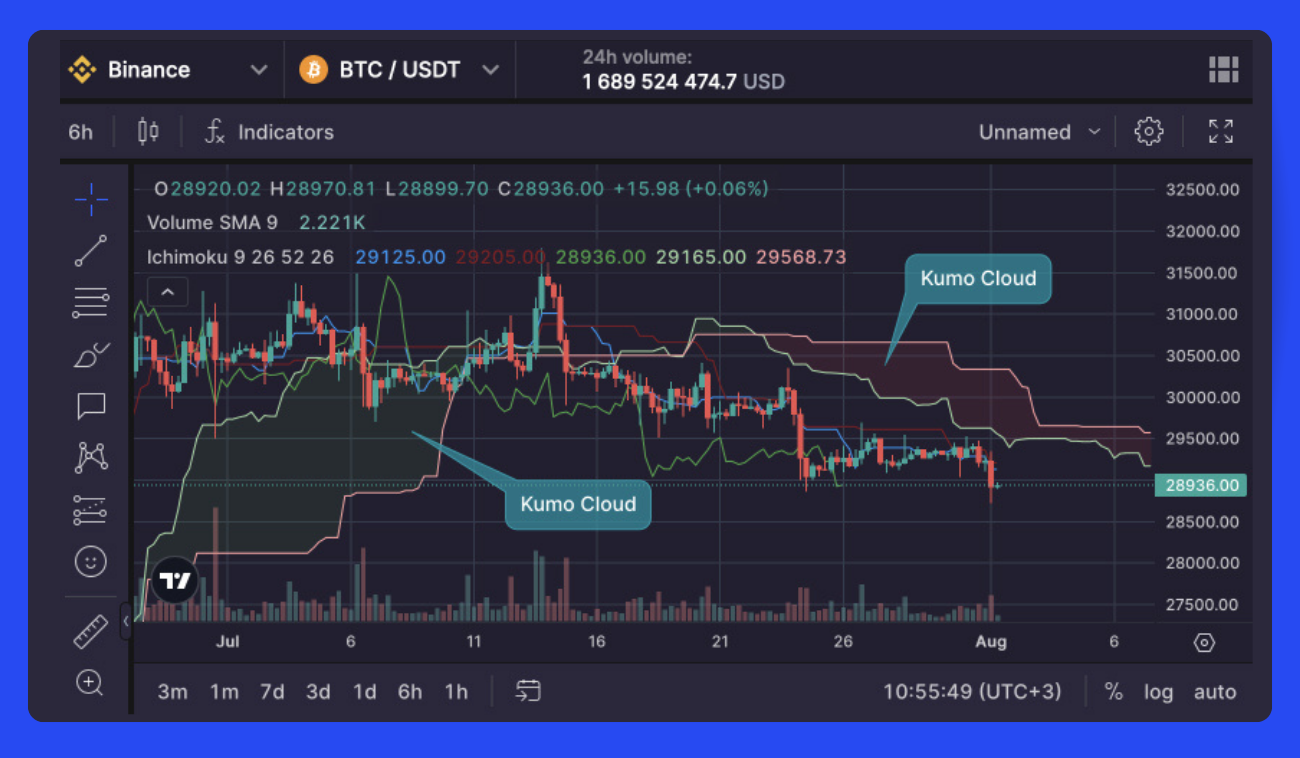
The Ichimoku Cloud typically appears in red or green for quick reference. The red cloud line corresponds to the Leading Span B, while the green cloud line represents the Leading Span A. A red cloud emerges when the Leading Span B surpasses the Leading Span A, and conversely, a green cloud arises when the Leading Span A exceeds the Leading Span B.
It's noteworthy that the moving averages used in the calculation of the various lines within the Ichimoku Cloud are based not on the closing prices of the candles, but on the high and low points recorded within a specific period.
How to Use Ichimoku Cloud Crypto
Despite the seeming intricacy, navigating Ichimoku’s graphical representation is surprisingly straightforward. Your quest begins with a simple game of 'spot the lines' — in this case, our stars are the Leading Span A and Leading Span B.
Having identified these two key lines, next, you breathe life into the cloud by adding a splash of color. If Leading Span A trails beneath Leading Span B, it signals that the cryptocurrency is on a downward trajectory, painting the cloud a stark shade of red. Conversely, if Leading Span A soars above Leading Span B, it heralds an upward surge in the price of the crypto asset, prompting you to brush the cloud in a hopeful hue of green.
Trading Signals Using Ichimoku in Crypto
Now, with your vibrant Ichimoku Cloud spread out before you, it becomes a powerful oracle to generate momentum and trend-following signals.
Momentum Indicators
Momentum signals echo the relationship between the market price, the Base Line, and the Conversion Line. Picture this: either the market price or the Conversion Line, or perhaps even both, leapfrog over the Base Line. The result? You’ve got bullish momentum.
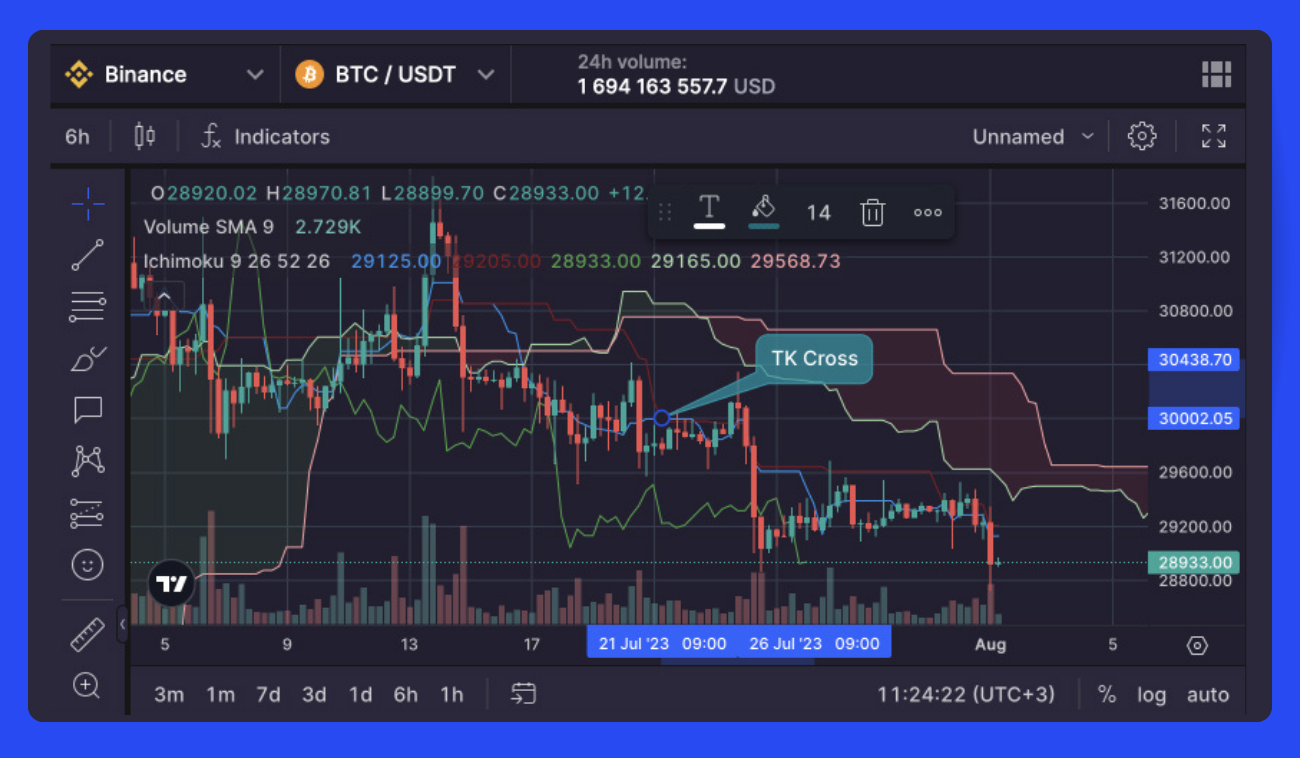
On the flip side, bearish momentum signals stage their appearance when either the market price or the Conversion Line, or both, slither beneath the Base Line. This crossing between the Conversion Line and the Base Line is fondly christened the TK cross (Pic. 4).
Trend-Following Signals
Trend-following signals are determined by the market price's position relative to the cloud, as well as the cloud's color. Picture a cryptocurrency's prices consistently soaring above the cloud — it's a clear sign that the cryptocurrency is surfing an upward wave. Conversely, if the prices dip below the cloud, your cryptocurrency is bearish, embarking on a downward spiral. Except for a handful of exceptions, the market price waltzing sideways within the cloud indicates a flat or neutral market.
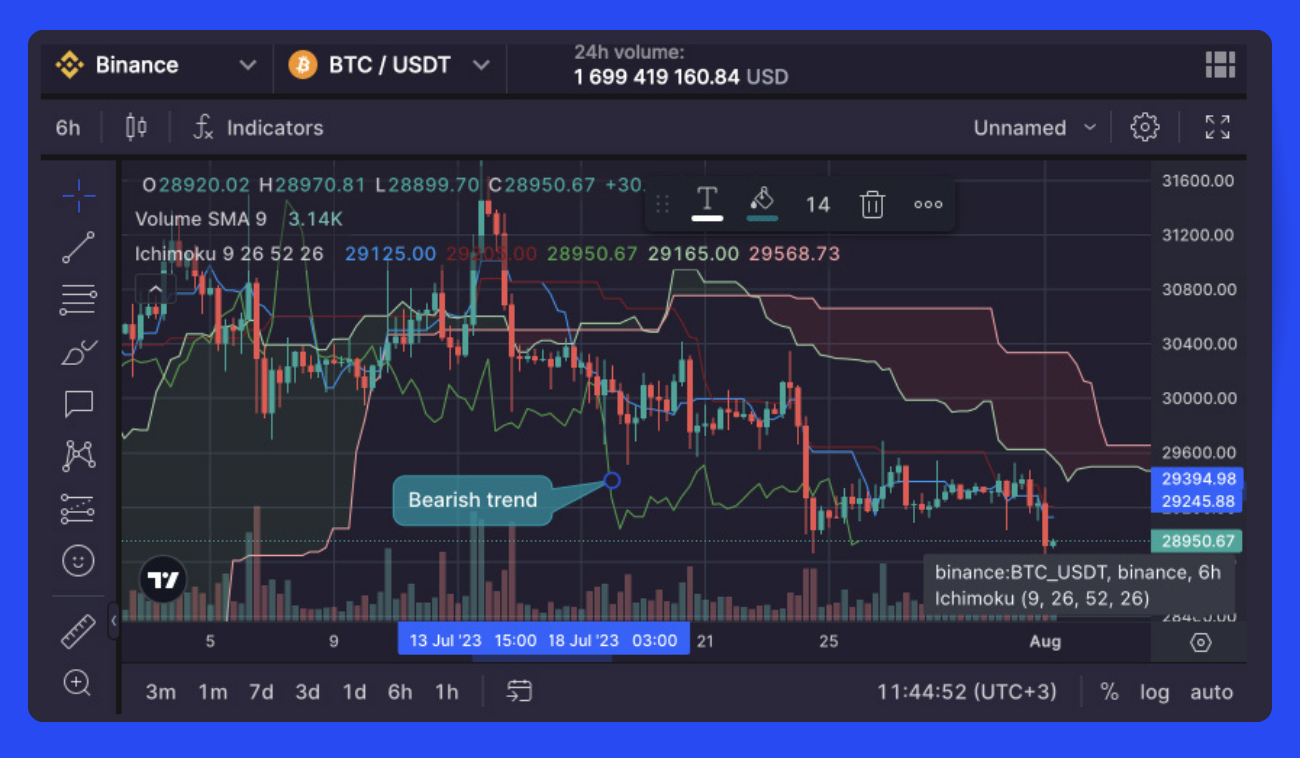
The Chikou Span, also known as the lagging span, is your trusty aide in spotting and confirming a trend reversal. This line provides a snapshot of the strength of price action. A potential bearish trend is flagged if it slips below the market prices (Pic. 5), and a bullish trend is hinted at if it climbs above the market prices. But remember, the Chikou Span is best used in concert with other components of the Ichimoku Cloud, rather than going solo.
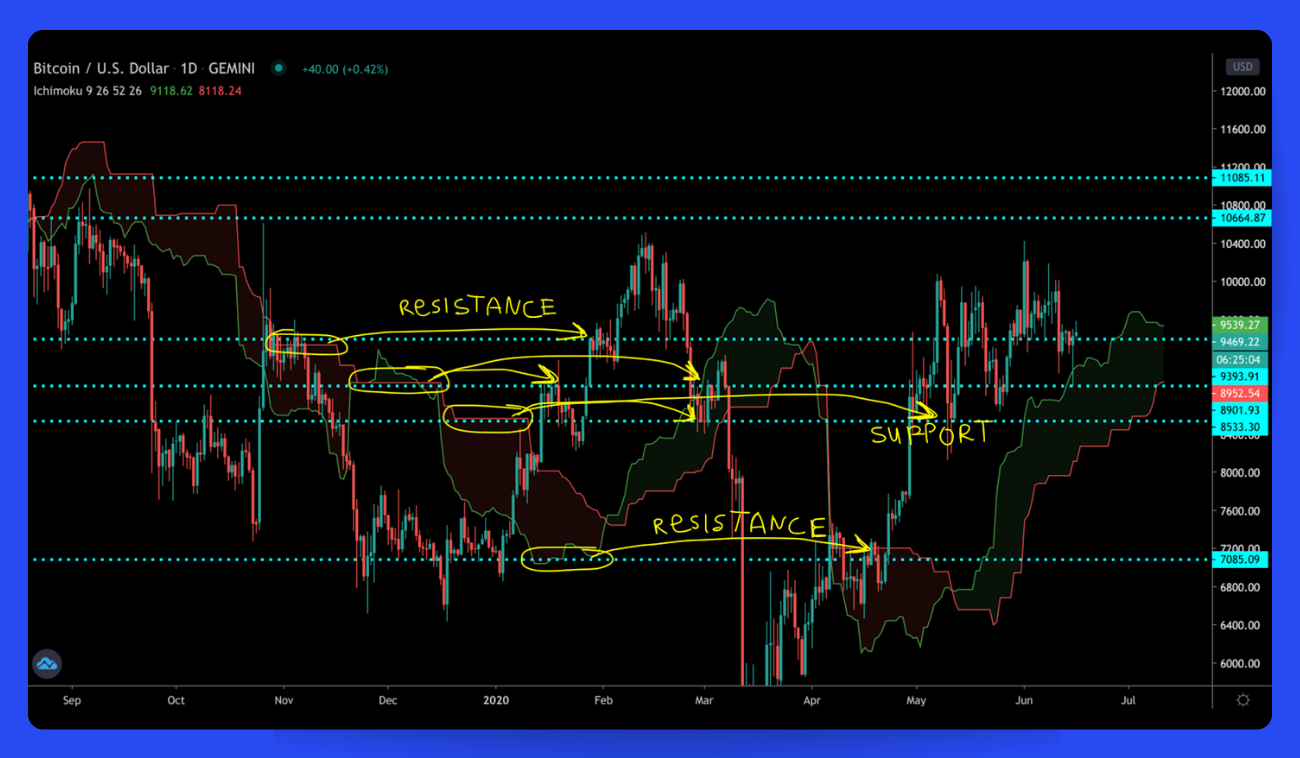
Support and Resistance Levels
The Ichimoku Cloud charts double as a compass for locating support and resistance zones. The Leading Span A usually plays the part of a support line in an upward market swing and morphs into a resistance line during downward trends. In both instances, the candlesticks cozy up to the Leading Span A or the green cloud line. Should the market price saunter into the cloud, the Leading Span B can also serve as a support and resistance line.
Crossovers
Crossovers are yet another key to unlock the potential of this technical indicator. Consider this scenario: the Conversion Line strides over the Base Line (Pic. 7), particularly when the market price of a cryptocurrency is perched above the cloud. This is interpreted as a strong buy signal, a green flag for action.
Ichimoku Cloud Settings for Digital Assets
After three prolific decades of relentless research and meticulous testing, Goichi Hosada, the creative mastermind behind the Ichimoku Cloud, arrived at the conclusion that the (9, 26, 52) configuration yielded the most effective results. In those times, Japanese business life incorporated Saturdays, hence, the number nine symbolized one and a half weeks, while the figures 26 and 52 corresponded to one month and two months respectively.
These configurations continue to hold sway in a plethora of trading scenarios. Nonetheless, within the dynamic crypto world, traders ingeniously recalibrate the Ichimoku settings to mirror the relentless 24/7 rhythm of the markets. Consequently, the settings morph from (9, 26, 52) to a more attuned (10, 30, 60). Some traders, in their quest to minimize deceptive signals, also manipulate the settings to (20, 60, 120).
👉 However, the discourse remains vibrant and unresolved regarding the efficacy of tweaking these settings. Some traders ardently uphold the conviction that it's crucial to adjust the Ichimoku configurations, while others express apprehension that these modifications could potentially destabilize the harmony of the Ichimoku system, resulting in an abundance of misleading signals.
Ichimoku-Based Crypto Trading Strategies & Tips
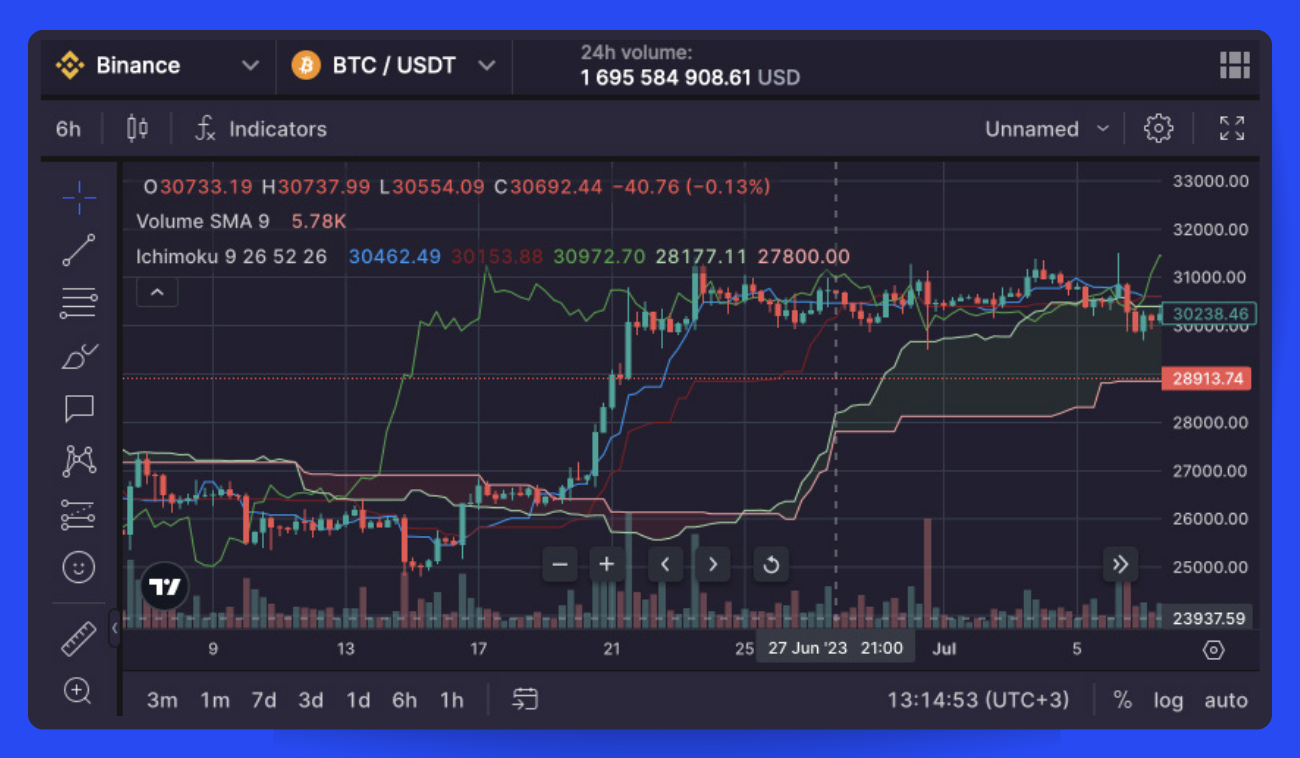
Primarily, the Ichimoku Cloud serves as a guide to discern market trends (Pic. 8):
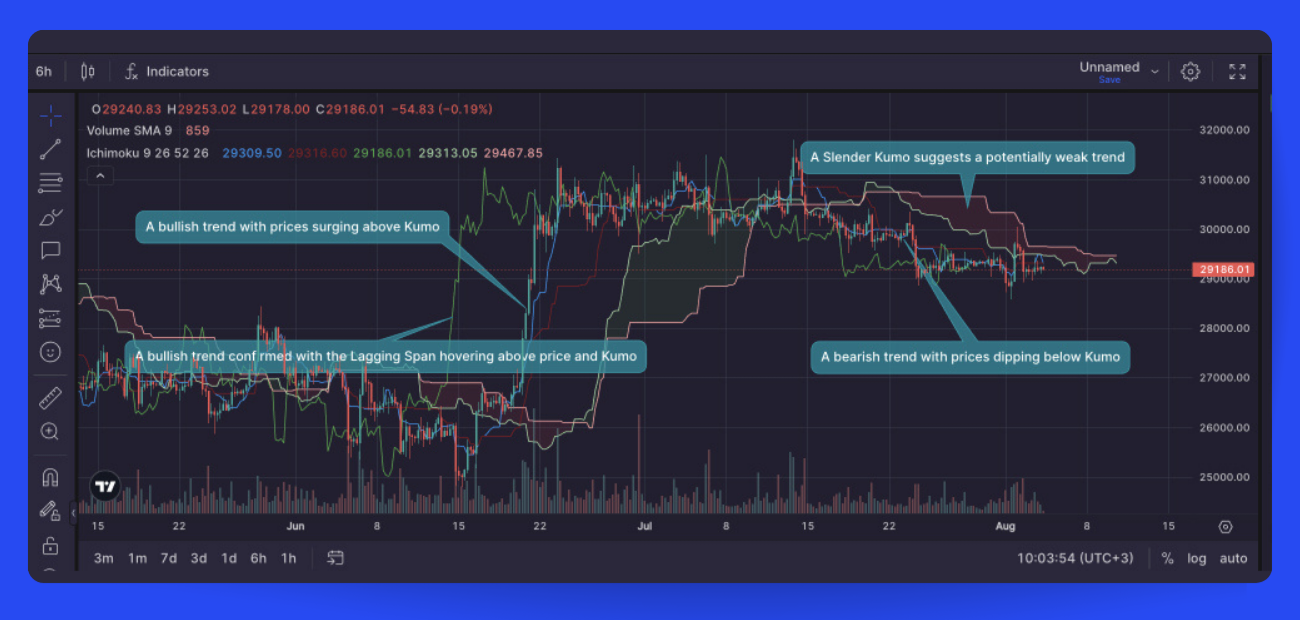
- The market is deemed bullish when the price soars above the Kumo, and conversely, a bearish market is indicated when the price plunges below the Kumo.
- If the price navigates within the Kumo, it signifies a market consolidation phase.
- The Kumo's colour also serves as a valuable indicator to comprehend the direction of the trend: a green Kumo foretells a bullish trend, while a red Kumo signifies a bearish trend.
- The Lagging Span is another useful tool to validate a trend. It suggests a bullish market when it hovers above both the price and the Kumo. Conversely, if it is charted below both the price and the Kumo, the market is likely bearish. It's important to note that the Lagging Span is a tool for confirming the trend, used by traders after they've set a bias based on other aspects of the indicator.
- The gap (or distance) between the Leading Span A and B, which form the Kumo, can assist traders in assessing the strength of the trend. A slender Kumo suggests a potentially weak trend, while a thick Kumo may indicate a strong one.
As mentioned, the Ichimoku Cloud is also a valuable tool to identify and capture market momentum (Pic. 9), which can provide excellent opportunities for entering and exiting trades:
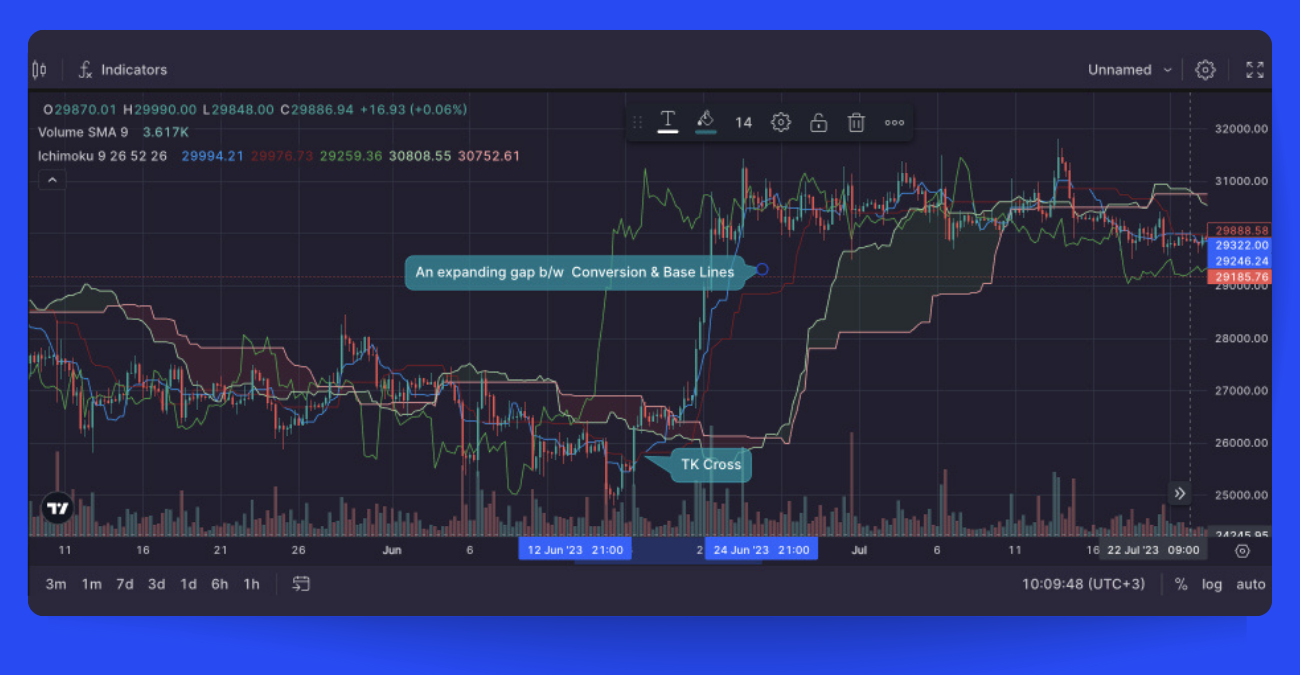
- Bullish momentum is potentially signalled when the Conversion Line crosses above the Base Line, while a crossover below the Base Line may indicate bearish momentum. This is referred to as a TK Cross.
- Moreover, an expanding gap between the Conversion Line and Base Line can suggest that the momentum is intensifying.
- The Kumo's position in relation to the price also offers crucial information about momentum. Strong bullish or bearish momentum is signified if the price moves above a rising Kumo or below a falling one, respectively. Conversely, if the price moves against the Kumo’s direction, it could suggest a weakening trend or a potential trend reversal.
Lastly, the Ichimoku Cloud offers dynamic support and resistance levels. These levels can also help locate entry and exit points:
- The edges of the Kumo, formed by Leading Span A and Leading Span B, act as the primary support and resistance levels. In an uptrend, the Kumo’s upper edge (usually Leading Span A) serves as support, while during a downtrend, the lower edge (usually Leading Span B) serves as resistance.
- It’s also possible for the opposing edge to act as support (when bullish) and resistance (when bearish). However, this would place the price within the Kumo. Although it’s best to avoid taking a position inside the Kumo, it can help prepare for an entry if the level holds and the price reemerges from the Kumo. In case the price breaches these levels, it could signal a potential trend reversal.
- Besides the Kumo, the Conversion and Base Lines also serve as minor support and resistance levels. When the price is above these lines, they can act as support, while if the price is below them, they can serve as resistance.
Using these interpretational tips, we can now craft an Ichimoku Cloud cryptocurrency trading strategy. For example, we can establish specific criteria that must be met before contemplating a trade:
- If bullish, price should be above the cloud and the cloud should be green. If bearish, price should be below the red cloud.
- In an uptrend, the Lagging Span should be above price and cloud. In a downtrend, it should be below.
- If bullish, Conversion Line should be above Base Line. If bearish, below Base Line.
Once these criteria are met, we can look for entries:
- We can enter on the crossover if we're only waiting for the Conversion to cross the Base. If all three requirements are already met, we may enter on a retrace to the Conversion or the Base Line. Entering on the Conversion Line can be considered riskier, while waiting to enter the Base Line may mean missing opportunities.
- We can make an entry after confirming that Leading Span A (if bullish) or Leading Span B (if bearish) is acting as support/resistance.
For stop losses, you can try at the opposing edge of the Kumo or use another technical factor for a tighter stop. Setting take-profit levels with the Ichimoku is challenging. You may prefer to simply trail a stop above or below the Kumo, depending on the direction of your trade, or close the position when the Conversion line crosses back over the Base.
Combining Ichimoku with Other Crypto Indicators
In the bustling world of cryptocurrency markets, even when trends take center stage, the Ichimoku indicator rarely performs a solo act. Traders usually integrate other technical analysis tools and methods, harmonizing them with the Ichimoku Cloud, to better forecast trend lines and support and resistance levels.
Here are some of the fan-favorite trading indicators that frequently share the stage with Ichimoku:
- Volume: This is the measure of how much of a particular asset is traded during a defined period. It serves as a pulse check on the intensity and significance of market moves.
- Momentum oscillators like StochRSI: These are advanced tools that traders use to gauge the speed (velocity) at which the price of an asset is moving. They're akin to a speedometer for the market traffic.
- Bollinger Bands: These are often used to offer range-like boundaries, serving as guardrails even when the market is caught up in a trending dance.
- Fibonacci levels (Fibs): These are used as a treasure map to pinpoint the most likely area where a price reversal might occur, offering traders a compass in the often unpredictable sea of market moves.
Using Bitsgap’s Powerful TA Tools Including Ichimoku
Searching for a robust technical analysis platform that offers both analytical and trading capabilities? Your quest ends at Bitsgap.
Bitsgap's integrated TradingView interface is a treasure trove of analytical tools that illuminate hidden trading opportunities. Besides the standard array of charts, charting instruments, and indicators, Bitsgap brings its own unique additions into the picture.
For tech-savvy traders, Bitsgap has the Technicals widget — a cutting-edge tool that blends signals from a multitude of indicators and oscillators. It's akin to the Fear and Greed index, combining and averaging signals from popular indicators to spotlight lucrative trade opportunities. Now, instead of checking each indicator individually, you can simply observe signals from the Technicals widget.
On top of this, Bitsgap spoils traders with advanced trading tools typically absent in most crypto exchanges. Think intelligent orders like Scaled or TWAP and trading bots like GRID, DCA, and COMBO futures.
For a deeper understanding of these tools, feel free to explore Bitsgap's Help Center at your own pace.
Eager to kickstart your Bitsgap journey? Seize the opportunity to sample the PRO plan with a week-long trial today. Explore, experiment, and test the plethora of tools we've discussed and more.
Cryptocurrency Ichimoku Cloud Case Studies
Let’s examine the following particular example:
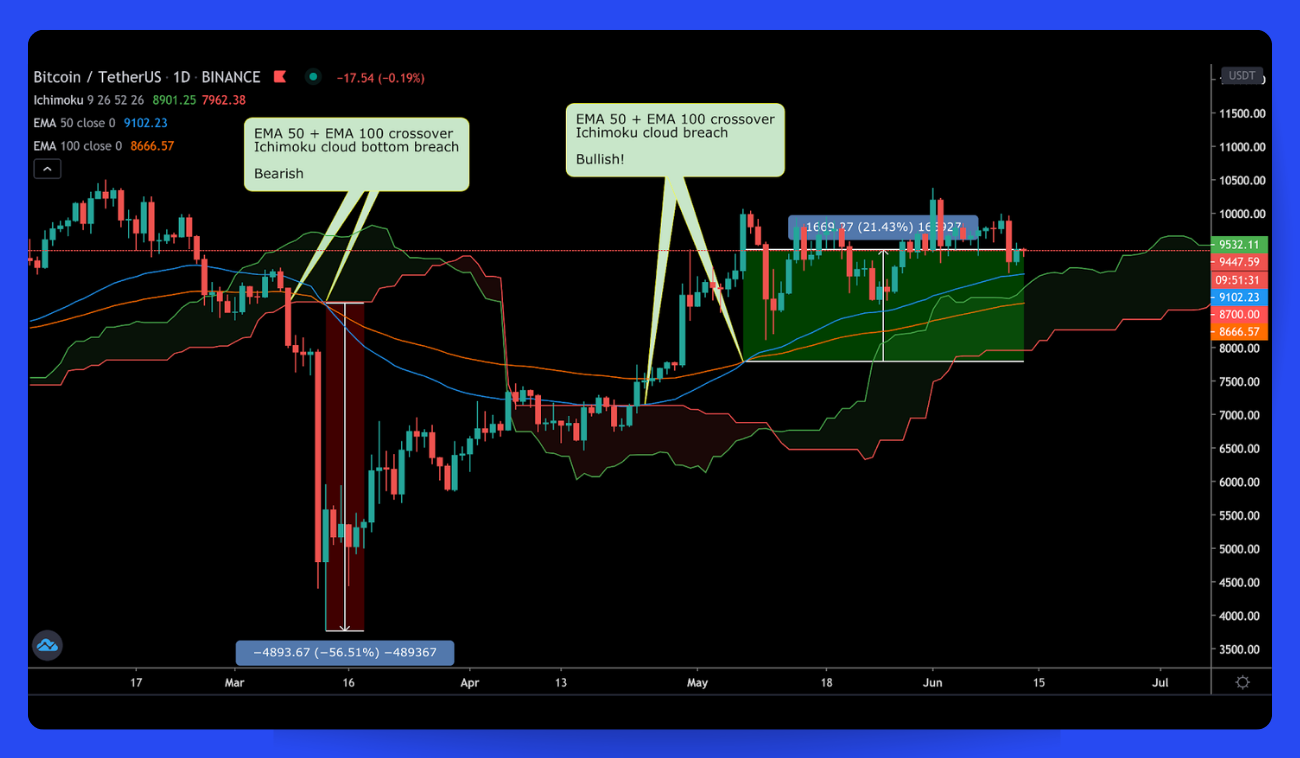
When the cost of a cryptocurrency is charted above the Ichimoku cloud, it signifies that the trend is experiencing robust upward momentum. On the flip side, if the price is tracked below the cloud, it implies that the trend is undergoing downward momentum.
A shift in trend can be signaled when the price punctures the cloud. The instance of the cloud breach from above, as showcased in the following chart (Pic. 11), is an ideal illustration of the market transitioning into a downtrend. The bearish trend is further validated when the plotted moving averages are intersected by the price. The amalgamation of standard exponential moving averages (EMA 50, EMA 100, EMA 200) and the Ichimoku cloud serves as a potent blend for market analysis:
Bottom Line
At first glance, the Ichimoku chart indicator might appear as a monstrous labyrinth of lines and clouds, potentially sending shivers down a newbie trader's spine. However, once unraveled, it morphs into an invaluable compass, guiding traders through the labyrinthine world of cryptocurrency trading.
For those who fancy darting through the fast-paced lanes of short-term cryptocurrency trades, the Ichimoku cloud strategy stands as a brilliant beacon in the storm. This strategy wields one of the rare sophisticated indicators that, despite its complexity, remains wonderfully intuitive to understand and effortlessly applicable in your crypto trading escapades.
While you could be tempted to walk the tightrope, using the Ichimoku indicator as your sole safety net, it's a high-risk gamble that's best avoided, particularly when you have a banquet of other options ready to corroborate a signal for you.
Given the volatile nature of crypto, it's strongly encouraged to rally the Ichimoku cloud indicator with a battalion of other indicators. You can also supplement your Ichimoku cloud strategy by automating some of your trading with ingenious tools like the Bitsgap trading bots.
FAQs
How to Use Ichimoku Cloud Crypto?
Understanding the Ichimoku cloud is fairly simple. If the price is above the cloud, it signifies an uptrend. Similarly, a downtrend is indicated when the price is beneath the cloud and in the red zone.
Trend and swing traders utilizing this indicator might contemplate a long position when the price is above the cloud and a sell trade when it's below. The cloud also serves to measure market volatility. A thick cloud often reflects high volatility, while a thin cloud suggests declining volatility.
The Tekan Sen and Kiju Sen can trigger a crossover signal, akin to the moving average crossover. It can also serve to further validate price action. Here's an image showcasing a cross.
The Chikou span can be used to corroborate the trend. A line crossing the price to the upside is deemed bullish and would validate an upward price breakout of the Ichimoku cloud. This typically coincides with the breakout, but occasionally, it can precede the breakout, acting as a preliminary signal of an upward move.
Conversely, when the line crosses the price to the downside, it's considered bearish and would validate a downward price breakout of the Ichimoku cloud. This might align with the breakout, but sometimes, it can precede the breakout, serving as an early sign of a downward move.
The Senkou span can function as a support and resistance line. Depending on whether the price is above or below it, the two lines can serve as dual levels of support and resistance.
Does Ichimoku Cloud Work for Crypto?
Yes, most certainly. The Ichimoku Cloud indicator is a prevalent and highly effective technical tool used in cryptocurrency trading. It informs traders about the market's bearish or bullish state, potential support or resistance levels, and possible trend shifts. It's particularly useful for day trading cryptocurrency with its conventional default settings.
Interestingly, the Ichimoku Cloud indicator is among the few tools that can be tailored specifically for cryptocurrency trading. Given the importance of time in relation to the Ichimoku's bearish and bullish signals, it plays a crucial role in customizing the tool's settings to align with the crypto market dynamics.
Traditional market settings for the Ichimoku Cloud are (9, 26, 52, 26). Here, 9 symbolizes a week and a half of trading activity, while 26 represents the number of trading days in a typical month excluding Sundays. 52 stands for two months of trading days.
Given that the crypto market operates around the clock, including nights, weekends, and holidays, it's logical to adjust the settings to cater to these unique crypto market conditions. Thus, custom settings for Ichimoku in the context of crypto are (10, 30, 60, 30).
For analyzing longer-term trends, the settings can also be configured to (20, 30, 120, 60), effectively doubling the duration of some of the shorter timeframe crypto Ichimoku settings.
Is Ichimoku a Good Strategy?
A seemingly effective strategy may incur losses, not because it's inherently flawed, but due to the trader's application of it. For instance, a scalper might boast a high win rate but still deplete their capital due to poor risk management, leading to a series of losses.
Conversely, a trader who adheres to prudent risk management, disciplined trading, and a well-planned strategy can indeed turn the Ichimoku into a winning strategy. However, this necessitates rigorous backtesting. Our experience shows that most traders lack positive expectancy to begin with. No amount of risk management or trading psychology can compensate for the lack of a robust strategy.
The Ichimoku empowers you with insights into three crucial market aspects: trend, support and resistance, and trend strength. This positions it as a potent tool for the astute trader. Nevertheless, it's essential to backtest it to ascertain its profitability for your chosen market.