Automated Strategies for GRID Trading: Market Formations
Unlock the secrets of the ever-changing crypto marketplace with automated GRID strategies, turning the ceaseless ripple of price fluctuations into a cascade of profitable opportunities.
Dive into strategies for automated bots, including optimal market timing, GRID configurations, and risk management.
Crafted to purchase cryptocurrencies at a dip and sell at a peak, GRID strategies leverage the constant ebb and flow of prices. Just visualize any chart, the price is always in motion. This dynamic translates into a plethora of opportunities for automated algorithms to execute trades, capitalizing on every possible gain.
The real question here is: When should you engage and disengage automated bots to reap the highest returns?
In this piece, we delve into automated GRID strategies, anchored on the basis of price pattern formations. Test these strategies in Bitsgap's demo-mode, a foolproof trading simulator designed for strategy experimentation and optimization, without risking a single dime!
Rising Channel
The Rising channel or an upward channel pattern, functions on the straightforward philosophy of price oscillations within predefined support and resistance boundaries, adhering to an upward trend.
A rising trend line, illustrated across the lowest points on a graphical representation, signifies a bullish support line. This line underscores the succession of progressively lower prices that the market can bear while preserving the ascending trend. Similarly, a rising resistance line delineates the sequence of increasingly higher prices (Pic. 1):
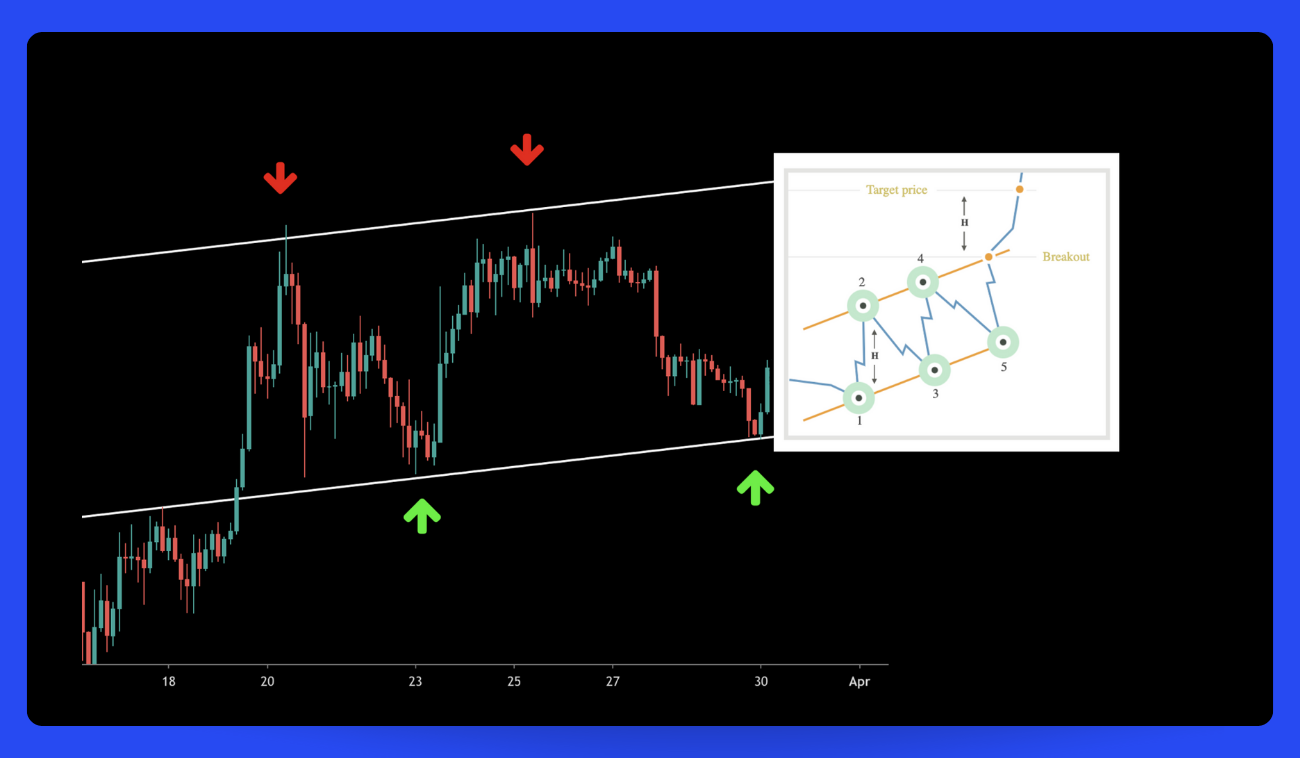
Though not set in stone, traders often require at least 2-3 touchpoints on each line before considering the channel sustainable. This filters out fleeting trends from tradable ones.
In accordance with the Rising channel pattern, traders adopt a long position when the price effectively rebounds from a decline to resume the upward trend. Here is a trading setup you could employ (Pic. 2):
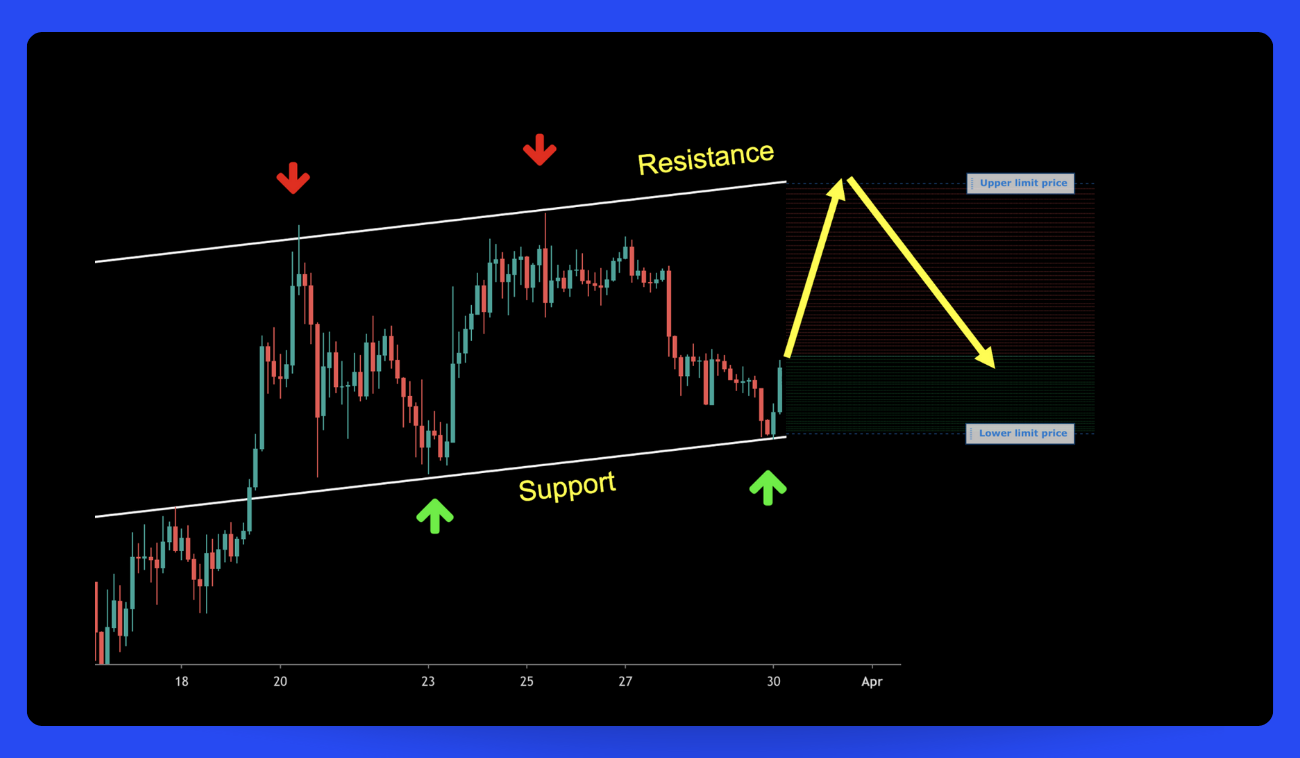
Your Strategy for the Rising Channel Formation
Capitalize on the Rising Channel with this game plan:
- Wait patiently for price to bounce off support. Watch for 2-3 bullish candles on the 4-hour chart to confirm the reversal.
- Enter long positions as price confirms lift-off from the support line.
- Set a wide profit-taking zone near the upper resistance level.
- Use a narrow buy-zone order to re-enter if price pulls back to support.
- Close positions as soon as price hits your profit target near resistance.
- Alternatively, trail stops higher to ride an accelerated uptrend breaking out above resistance.
- Set stop-losses below support to contain downside risk if the channel fails.
👉 Pro Tip: Analyze channels on longer timeframes like weekly or daily charts to see the overarching structure. Then refine entries on shorter timeframes like 4-hour or 1-hour. The higher perspective guides direction, lower timeframes optimize timing.
Rectangle Top
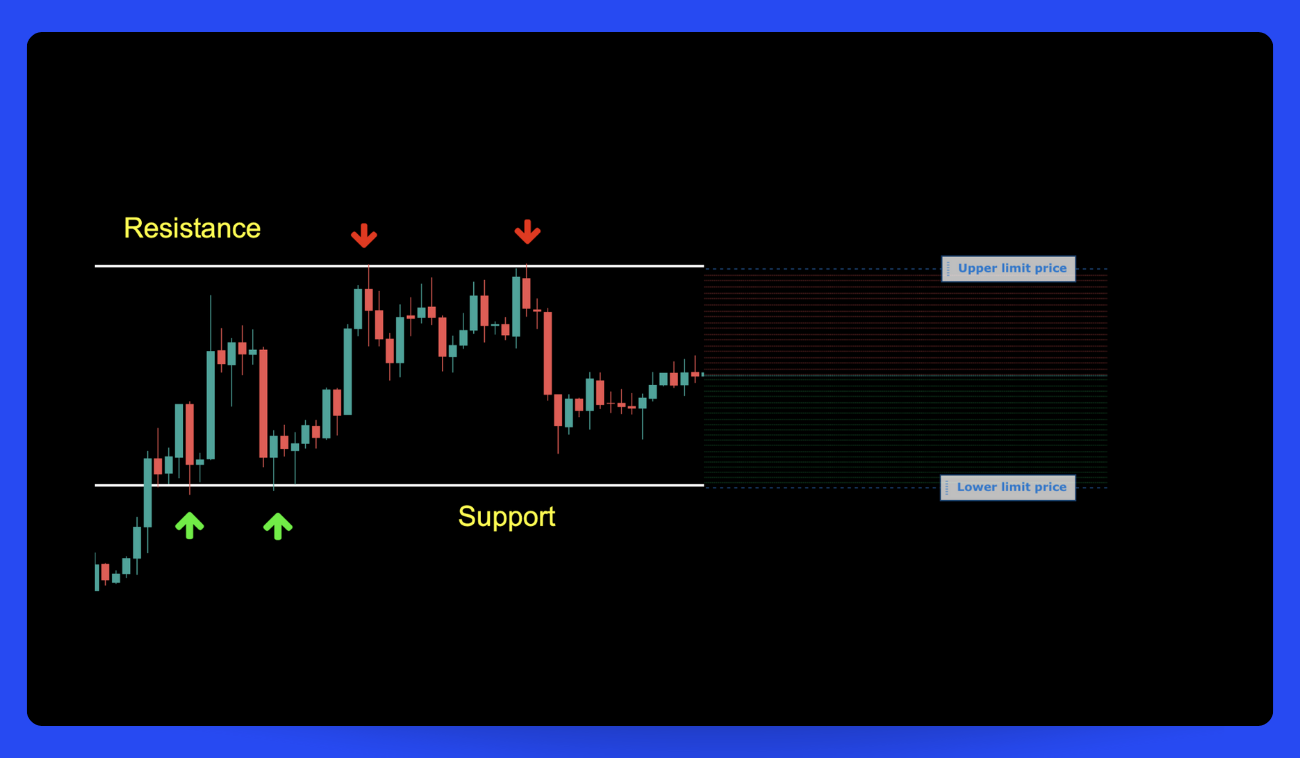
The Rectangle Top pattern forms when price becomes boxed within horizontal support and resistance lines. The choppy price action carves out a trading range, with price oscillating between the upper and lower boundaries. This sideways consolidation results in a distinctive 'W' shape in the chart as bulls and bears wrestle for control. The horizontal nature of the support and resistance lines distinguishes the Rectangle Top from the angled channels in other chart patterns. This trading range indicates a balanced equilibrium between supply and demand before the next dynamic move (Pic. 3):
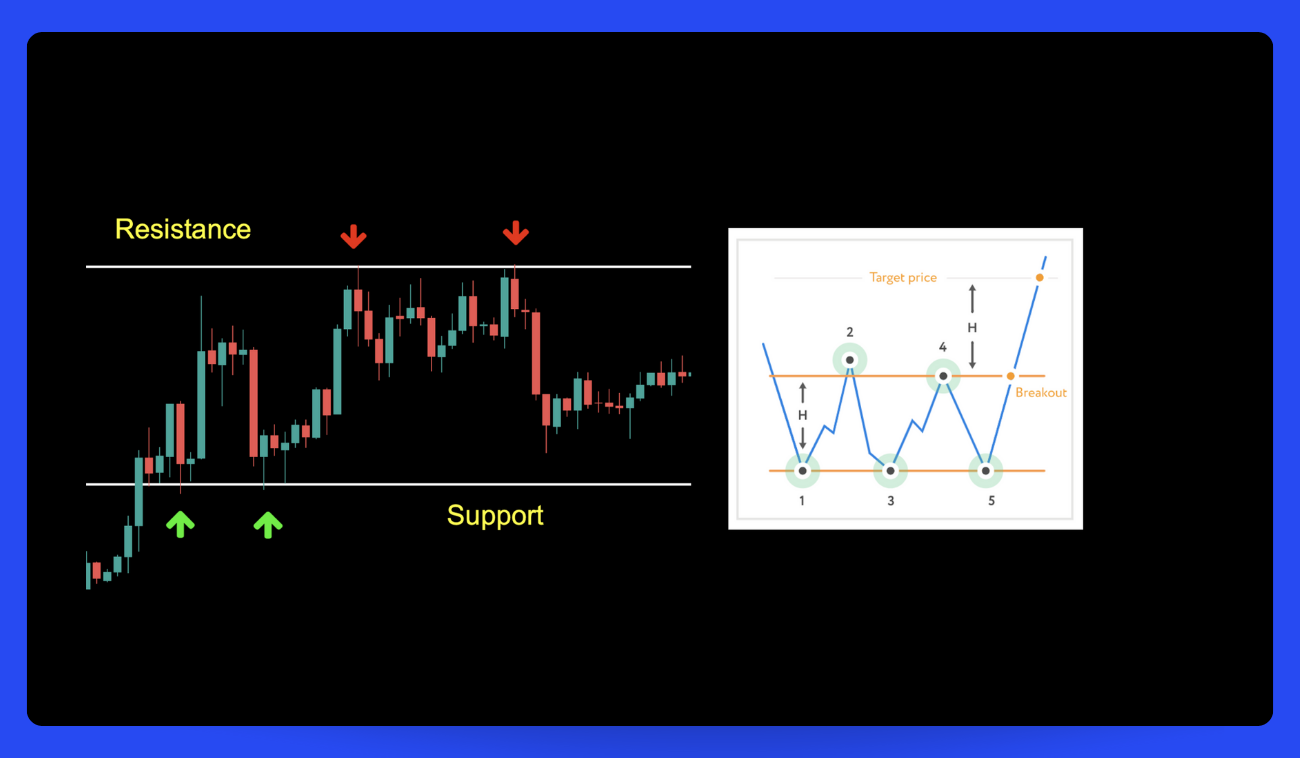
Here's a trading setup that you could put into practice (Pic. 4):
Your Strategy for the Rectangle Top Formation
Here's your course of action:
- Enter long after price bounces off support or in the middle of the range.
- Set a 50% profit-taking zone near the upper resistance level.
- Use 50% of capital to re-enter if price pulls back to support.
- Close positions as soon as price hits your profit target near resistance.
- Alternatively, trail stops higher to ride an accelerated breakout above resistance.
- Set protective stop-losses below support to limit downside.
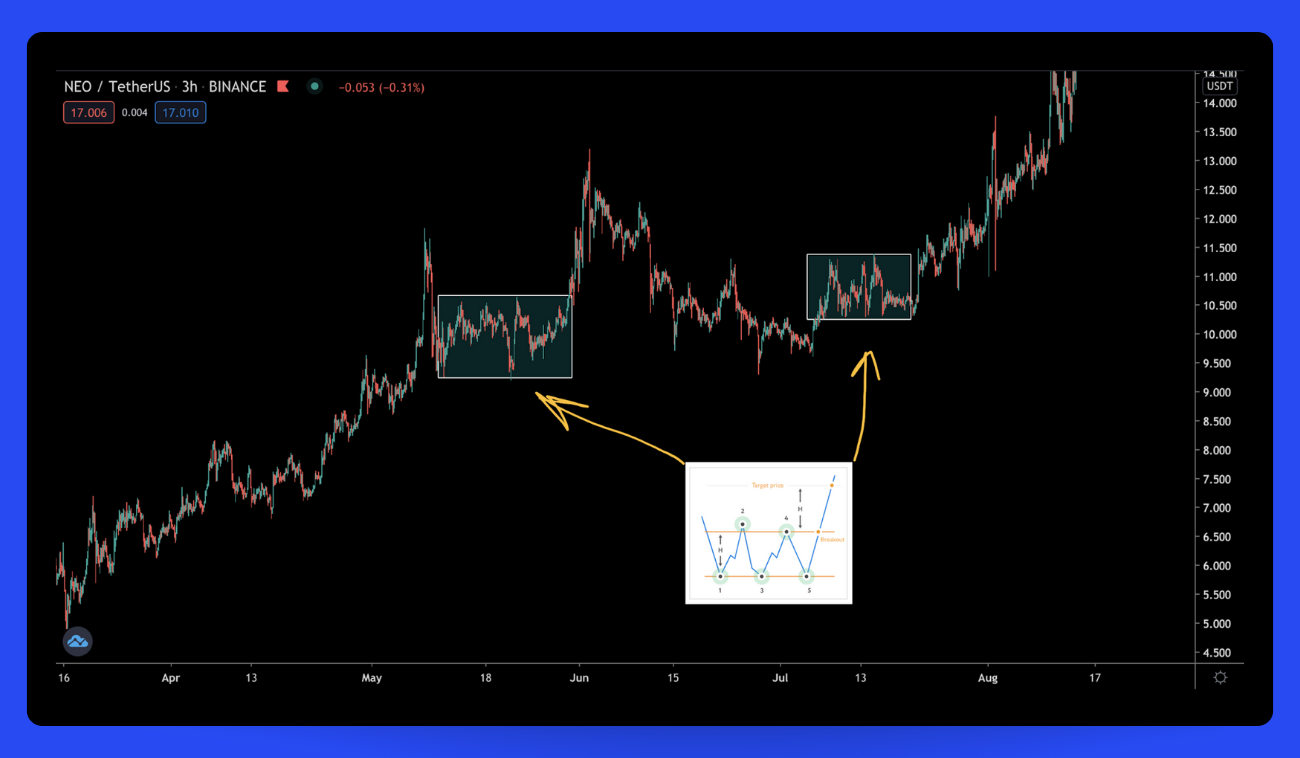
When you identify a Rectangle top pattern within an upward trend, as depicted in the following chart (Pic. 5), it instills greater assurance that the price will ultimately breach the resistance line to set a new peak. Remember, the trend is your friend!
Symmetrical Triangle Top
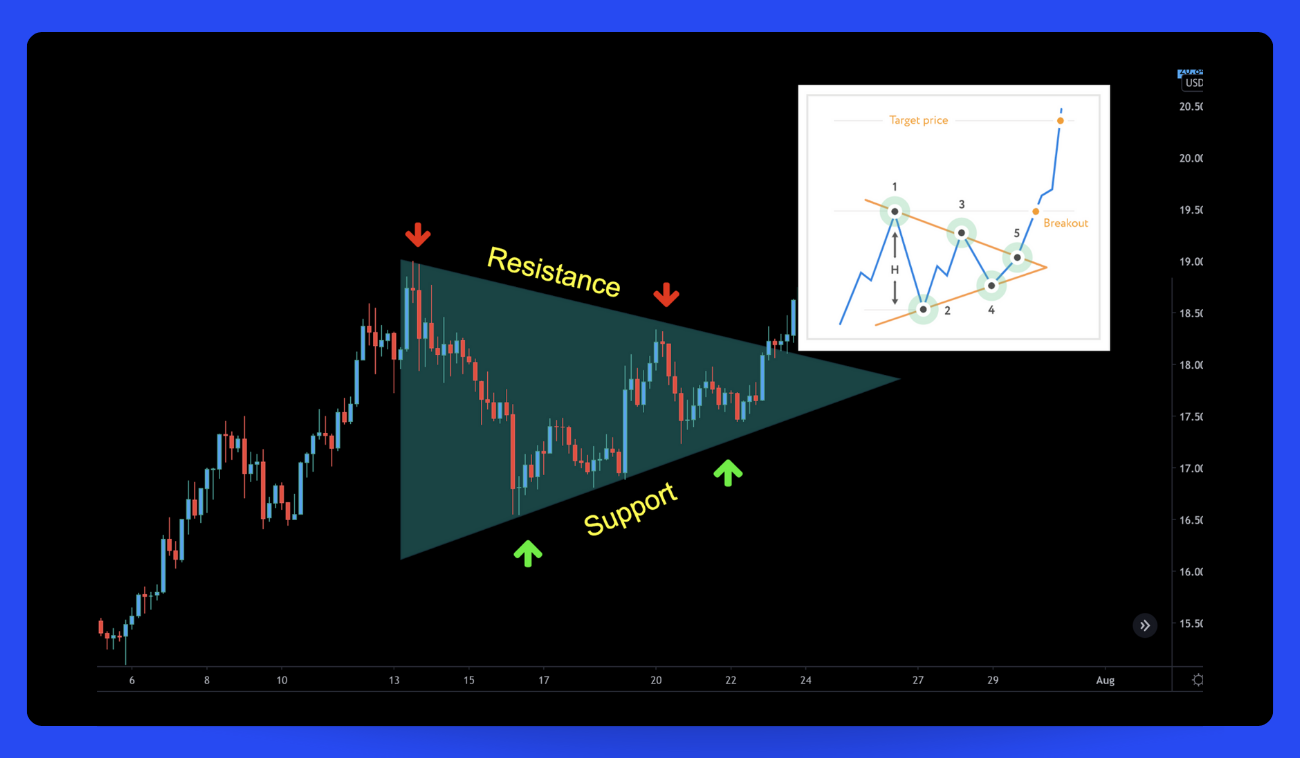
The subsequent pattern, known as the Symmetrical Triangle Top, is shaped by a downward sloping resistance line — a result of sellers driving down the price, and an upward sloping support line — where buyers are mitigating the selling pressure.
The price oscillates within these lines, resulting in a breakout from the resistance line that traders anticipate for bullish confirmation. At point 5, as depicted in the graph below (Pic. 6), the price breaks free from the pattern formation as it successfully penetrates the resistance. Some traders initiate buying precisely at point 5.
However, other traders may choose to wait until the price reaches its peak within the pattern formation, point 1. This latter strategy is more suitable for traders who place a stop-loss order close to the opening price, from a risk management standpoint.
On the other hand, the former strategy, where traders adopt a long position at point 1 (refer to the graph), necessitates a broader stop-loss.
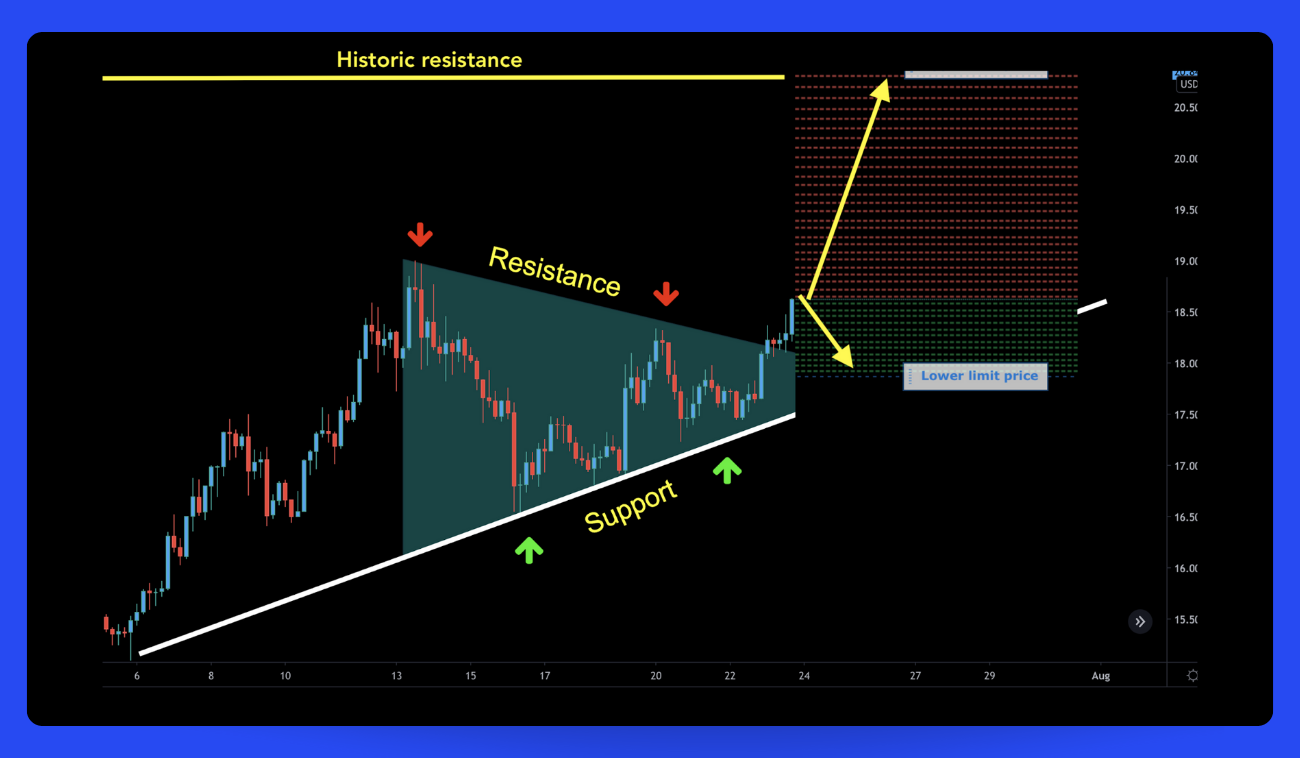
Trading Bot Configuration for Symmetrical Triangle Top Pattern:
- Enter long at the initial resistance breakout (point 5) or on a retest.
- Set a wide profit-taking zone near previous swing high resistance.
- Use a narrow zone to re-enter long on pullbacks to support.
- Close positions as soon as price hits your profit target.
- Alternatively, trail stops just below resistance to ride an extended move.
- Use stops under pattern support to contain downside risk.
👉 Tip: From a statistical standpoint, using longer time frame charts helps to eliminate a substantial portion of the "noise" that can hinder your view of the overall trend. The weekly chart offers directional guidance, while the daily chart, or even the 4-hour or hourly charts, are useful for determining the optimal times for entries and exits.
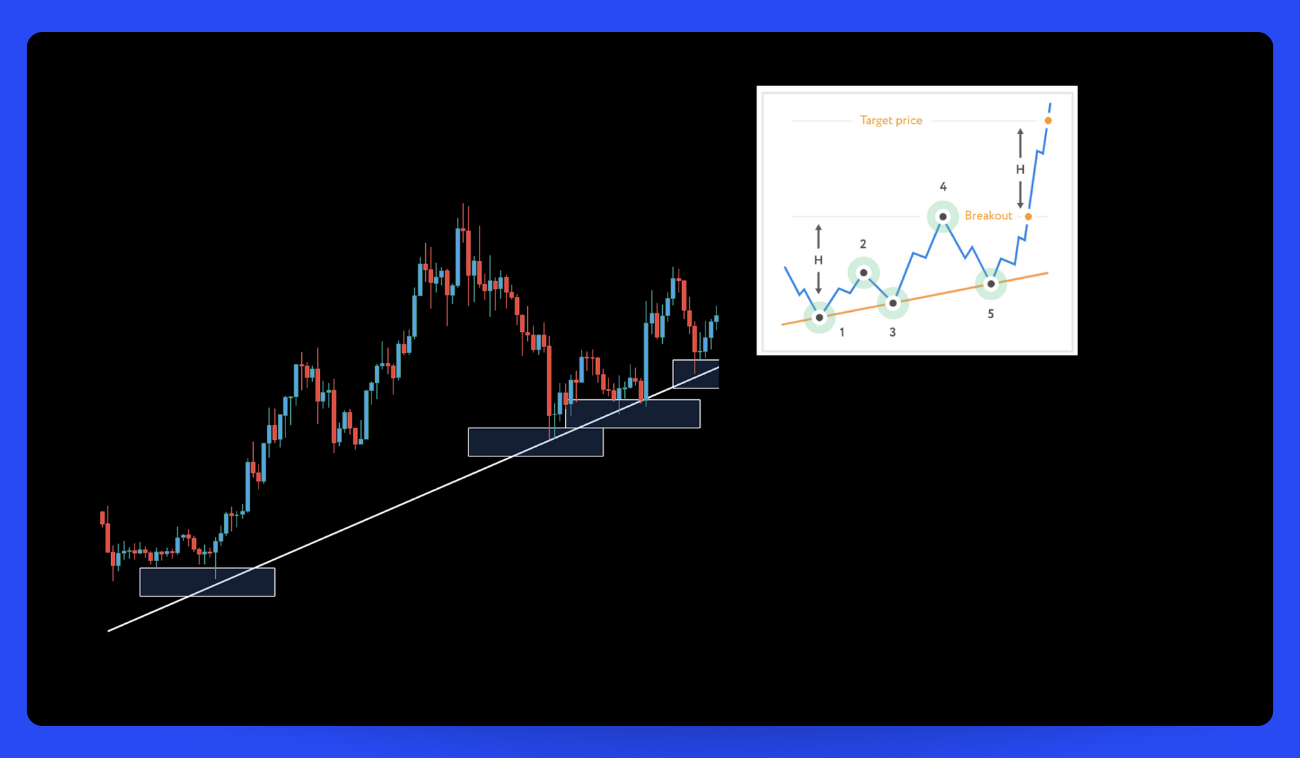
Three Rising Valleys
The Three Rising Valleys pattern forms as correction lows stair-step higher along an uptrending support line. Each valley bottom carves out a higher low (points 1, 3, 5 on the chart in Pic. 8).
This pattern can emerge at the end of downtrends, signaling buyers regaining control from sellers. It also frequently forms within uptrends as bulls consolidate before pushing higher again.
Some traders buy the initial bounce off support at point 5, betting on a trend resumption.
Others wait to ensure it succeeds by buying the retest at point 4 after the highest high.
Buying the first valley keeps risk tighter but has less confirmation. Waiting for the retest adds confidence but requires placing stops wider below the pattern. As always, choose the approach that fits your style.
Either way, Three Rising Valleys displays the market carving out a new floor. Expect ascending lows to precede a breakout to new highs.
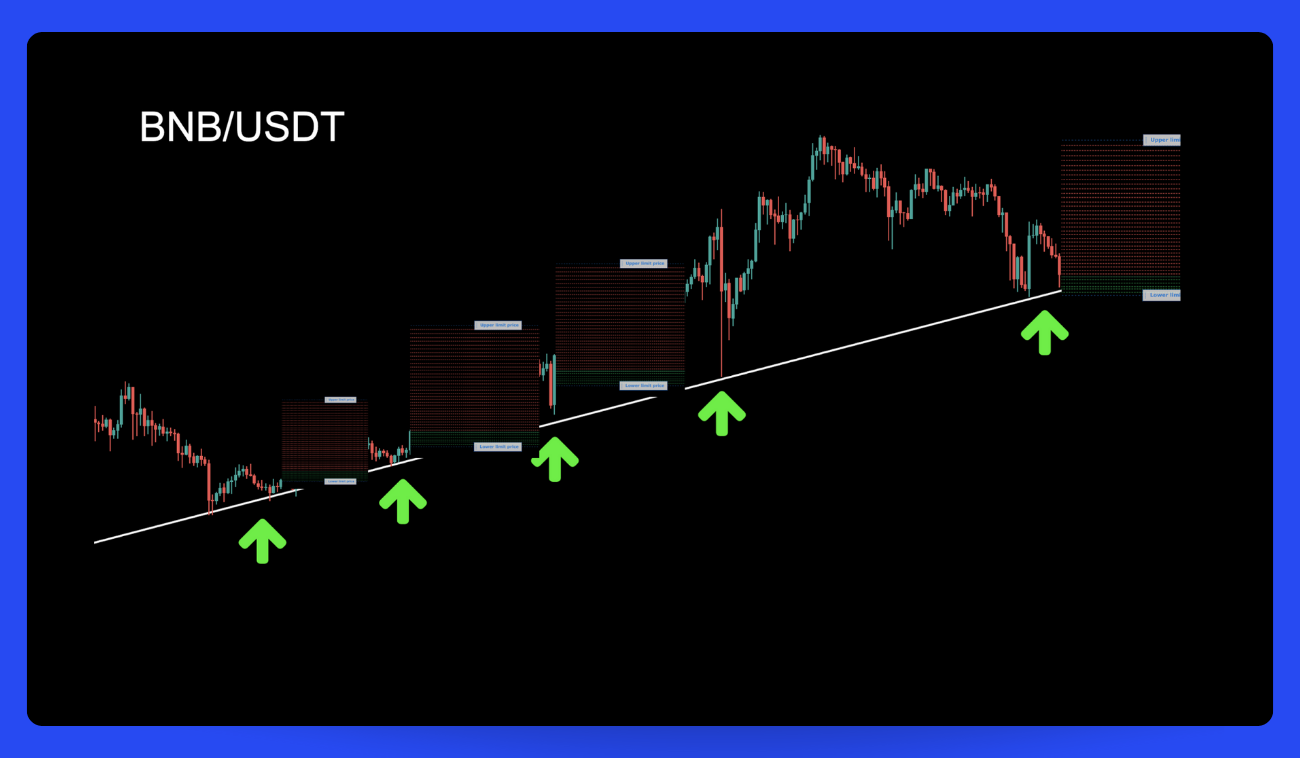
Trading Bot Configuration for Three Rising Valleys Pattern:
- Enter long at the bounce off support (point 5) or on retests at point 4.
- Set a wide profit-taking zone near previous swing high resistance.
- Use a narrow zone to re-enter long on pullbacks to support.
- Close positions as price hits your profit target.
- Alternatively, trail stops just below resistance to ride an extended move.
- Use stops under pattern support to limit downside risk.
Bottom Line: In Search for an Optimal Trading Pattern
The patterns discussed are just a few of the many effective trading setups. Over 42 unique chart formations exist, divided into bullish and bearish categories.
Ultimately, discover and master the patterns best suited to your personal trading style. Look for bullish signals like rising channels and ascending triangles in confirmed uptrends. Or use bearish patterns like descending wedges to profit from downturns.
The key is matching high-probability patterns with the overriding trend. Bull markets breed bullish setups. Bear markets bear fruit for bearish trades. By aligning technicals with fundamentals, you generate the ideal environment for any pattern to blossom into profits.
Bitsgap As Your Optimal Trading Partner: TA + Bots + Smart Trading Terminal
If you’re looking for an advanced trading interface rife with technical analysis tools and cutting-edge automation, look no further than Bitsgap!
The Bitsgap lets you integrate 17+ top exchanges into one sleek interface brimming with advanced tools you won't find anywhere else.
Our TradingView charts are fully stacked with every indicator under the sun to help spot opportunities so no stone is left unturned in your quest for alpha.
For pro technical traders, our proprietary Technicals widget condenses signals from dozens of top indicators into one customizable tool to pinpoint profitable trades, while the smart terminal gives you ultimate control with automated take profit, stop loss, trailing, and OCO orders.
Bitsgap's army of automated bots tirelessly execute your strategy even while you sleep! Customizable algorithms range from set-it-and-forget-it DCA to high octane GRID scalping. Extract money from the markets on your terms! This is next-level stuff!
Why trade on primitive exchanges when you can tap into an integrated platform built for charting, executing and managing winning crypto trades seamlessly?
FAQs
What Is Algorithmic Trading Based on Market Patterns?
Algorithmic cryptocurrency trading utilizes pre-programmed rules and instructions to automatically analyze market data and identify recurring patterns.
The algorithms are designed to detect opportunities to profitably trade based on identified trends, reversals, continuations, correlations, and other statistical patterns. Once a pattern is recognized, the algorithm can automatically execute trades without human intervention. This efficient, rules-based approach aims to capture trading opportunities and manage risks.
However, careful oversight is critical, especially in volatile cryptocurrency markets, to ensure the algorithms are performing as expected.
Effective algorithmic trading requires robust algorithms, prudent risk management, and ongoing performance monitoring.