
Using Stochastic and Stoch RSI Indicators in Crypto Trading
Unlock the power of Stoch and Stoch RSI, two pivotal technical analysis tools that can help you navigate market trends and spot lucrative entry and exit points with precision.
The Stochastic and Stochastic RSI comb through mountains of data to spot clues traders might miss. Keep reading to discover how they can help you gain an edge.
Technical analysis offers valuable insights to crypto traders navigating the often turbulent waters of this volatile asset class. Each tool in the arsenal serves a distinct purpose and plays a vital role.
Among the widely used trading indicators today are the Stochastic and Stochastic RSI. These tools merit further examination, which we will undertake in this article.
So join us as we delve into their differences, applications, and examples.
Stochastic Indicator in Crypto Trading Explained
The stochastic oscillator, created by George Lane in the 1950s, was designed as an effective method for gauging price momentum.
Whether it still lives up to its purpose is another question that will be addressed later, but for now, let’s see what stochastic is and how it works.
So, a stochastic oscillator is a momentum indicator that compares a specific closing price of an asset to a range of its prices over a particular time frame. By adjusting the time period or applying a moving average to the result, you can fine-tune the oscillator's sensitivity to market movements.
👉 This range-bound oscillator, always fluctuating between 0 and 100, can be a powerful ally in detecting overbought and oversold market conditions. Readings over 80 show momentum is full-throttle, meaning a coin is overbought and due for a correction. Under 20 signifies momentum has stalled out, so the coin is oversold and ready to rally.
However, it’s never quite straightforward. The signals don't always foretell an imminent reversal, as strong trends can uphold such conditions for quite some time. So, it’s important to keep an eye on the stochastic changes to stay ahead of the game and spot potential trend shifts.
Stochastic oscillator charts (Pic. 1) typically consist of two lines: one reflecting the oscillator's actual value for each session and another showing its three-day simple moving average. Since price is believed to chase momentum, the crossing of these lines could herald an approaching reversal due to a significant momentum shift.
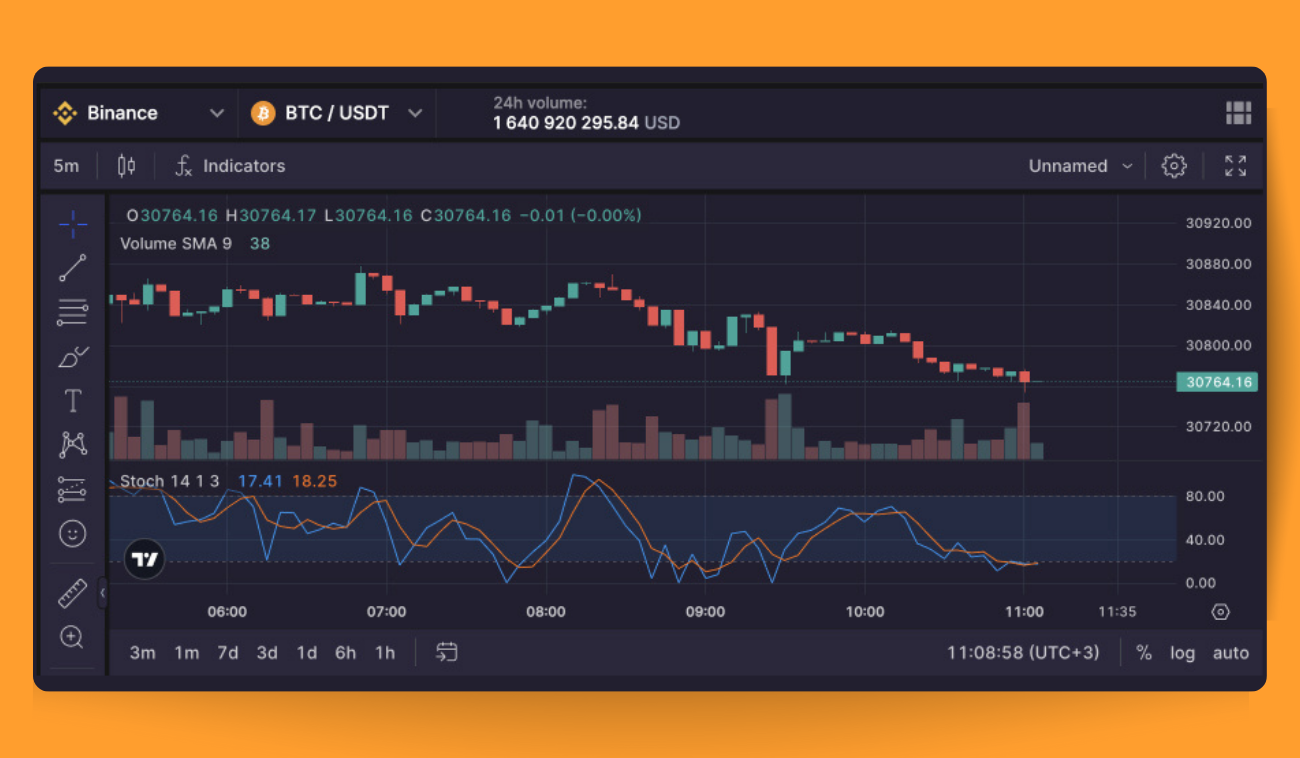
Take note of the divergence between the stochastic oscillator and the price trend — it's a reversal signal. For example, if a bearish trend hits a new lower low while the oscillator traces a higher low, the bears might be running out of steam, and a bullish reversal could be brewing.
How to Read Stoch
Stochastics can be effective in both range-bound and trending markets, depending on how you interpret the readings between 0 and 100.
The stochastic oscillator consists of two lines. The first line, called %K, represents the current closing prices relative to the defined high and low period. The second line, %D, is a simple moving average of %K. The most common setting for the stochastic oscillator is 14, 3, 3 or simply 14, 3, which indicates a 14-period look-back and a 3-period SMA for %K, which is %D (Pic. 2).
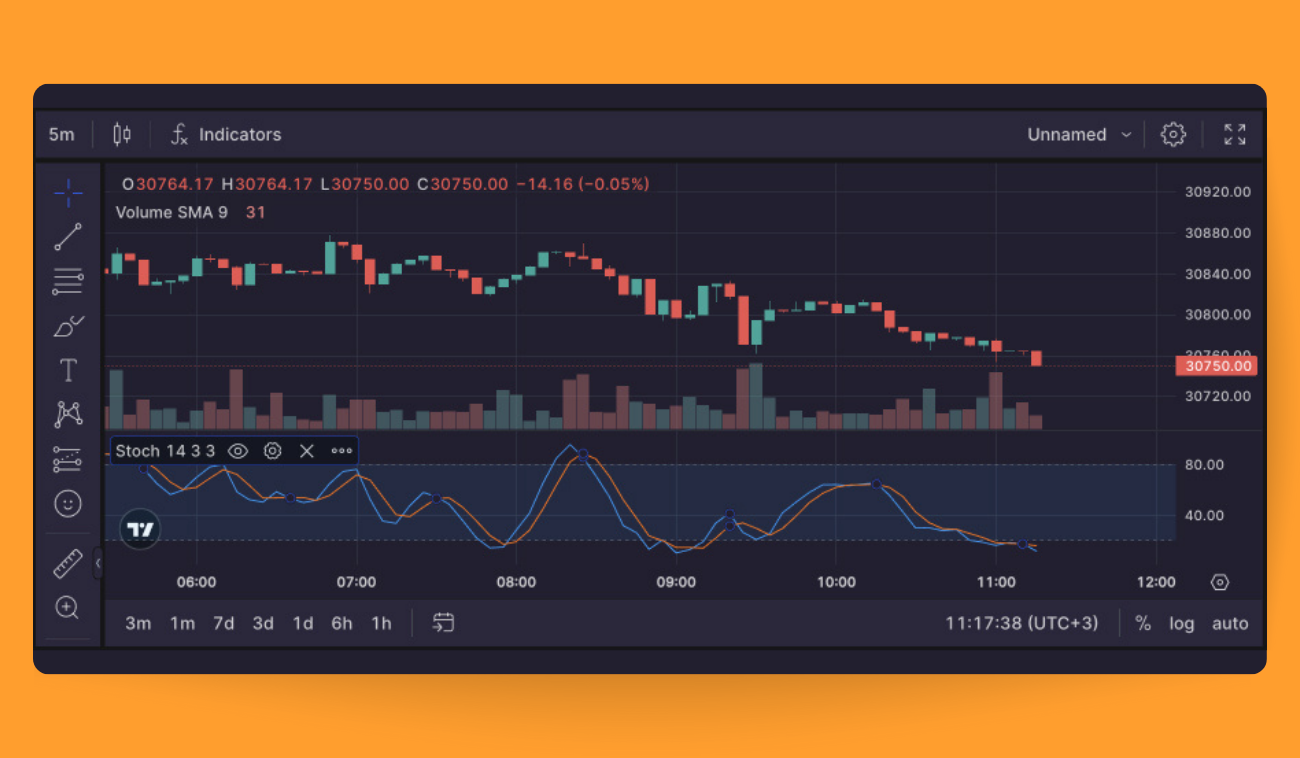
Additionally, there are fast and slow stochastics. The key difference between the two is that the slow %K incorporates a 3-period %K smoothing, controlling the internal smoothing of %K. By setting the smoothing period to 1, you'll be plotting the fast stochastic.
The most popular way to trade with stochastics is to combine the indicator with chart patterns and trend lines.
For instance, if the price closes in the upper half of the range for the past 14 periods' high and low, the %K line will rise, indicating increased momentum and more buying pressure in the market.
Similarly, when the price closes in the lower half of the range for the past 14 periods, the %K line falls or slopes downward, suggesting weakening momentum or increased selling pressure.
As %D is the simple moving average of %K, buy and sell signals are generated or the momentum is seen to increase and decrease even further when the %K crosses the %D line, similar to the general rules of moving averages.
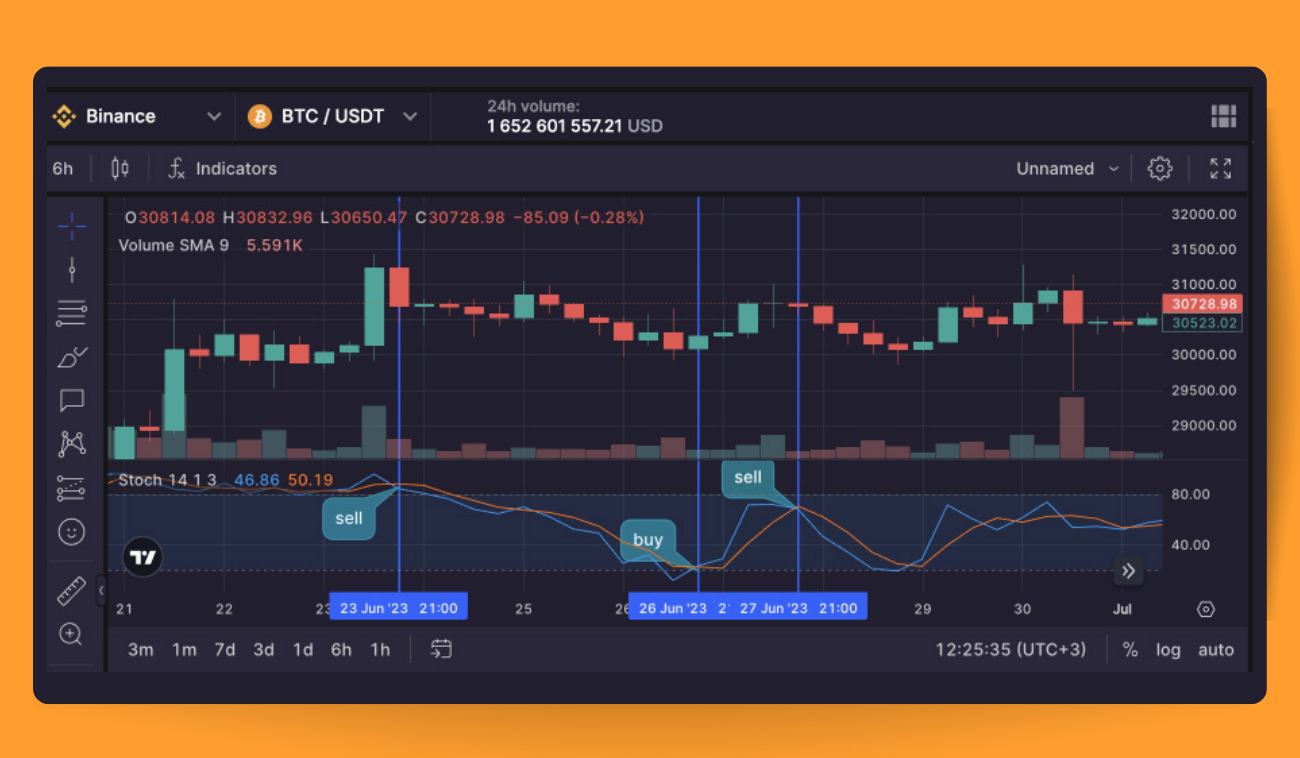
By combining stochastic readings with the trend, you can also pinpoint buying and selling opportunities.
What Kind of Cryptocurrency Trading Strategies Is Stoch Suitable For?
Stoch is a versatile tool that can be integrated into almost any trading strategy. As a decent indicator, it gives you a sneak peek into potential market movements before other indicators catch a glimpse.
This makes it a good choice for pinpointing potential entry and exit points, whether you're a daring cryptocurrency day trader, a savvy swing trader, or even a steadfast HODLer aiming to optimize prices and stack up more coins.
However, stochastic is not all smooth sailing.
First of all, it can throw off false signals, particularly in choppy or sideways markets. Then, contrary to its reputation as a leading indicator, stochastic can't entirely shake off its lagging nature as it still relies on historical price data. This means it might not always be quick enough to catch sudden market twists and turns or accurately predict what's coming next. Stochastic also hinges on your ability to read and discern true signals, which can be a challenge for a newbie. So, it’s best to pair it with other indicators for the full picture.
Stochastic RSI Crypto Trading Definition
The Stochastic Relative Strength Index, affectionately known as Stoch RSI, is another momentum technical indicator that draws inspiration from both the stochastic and the RSI indicators.
In essence, the Stoch RSI is the stochastic indicator's doppelgänger, but with action based on RSI levels rather than price levels.
The Stoch RSI was first brought to life in "The New Technical Trader," penned by a dynamic duo of Tushar S. Chande and Stanley Kroll. While other technical indicators already alerted traders to overbought or oversold conditions, StochRSI stepped up the game by boosting sensitivity and the number of signals the oscillator could reveal.
The principle behind its 0–100 reading is the same — when the action surpasses the 80 range, it enters "overbought territory," while any action below 20 is considered to be wandering into "oversold."
The Stoch RSI (Pic. 4) also features two lines: the K line and the D line. The 14-period K is crafted from the most recent close, the highest high across the last 14 periods, and the lowest low during the same timeframe. As for D, it's a 3-day simple moving average of K.
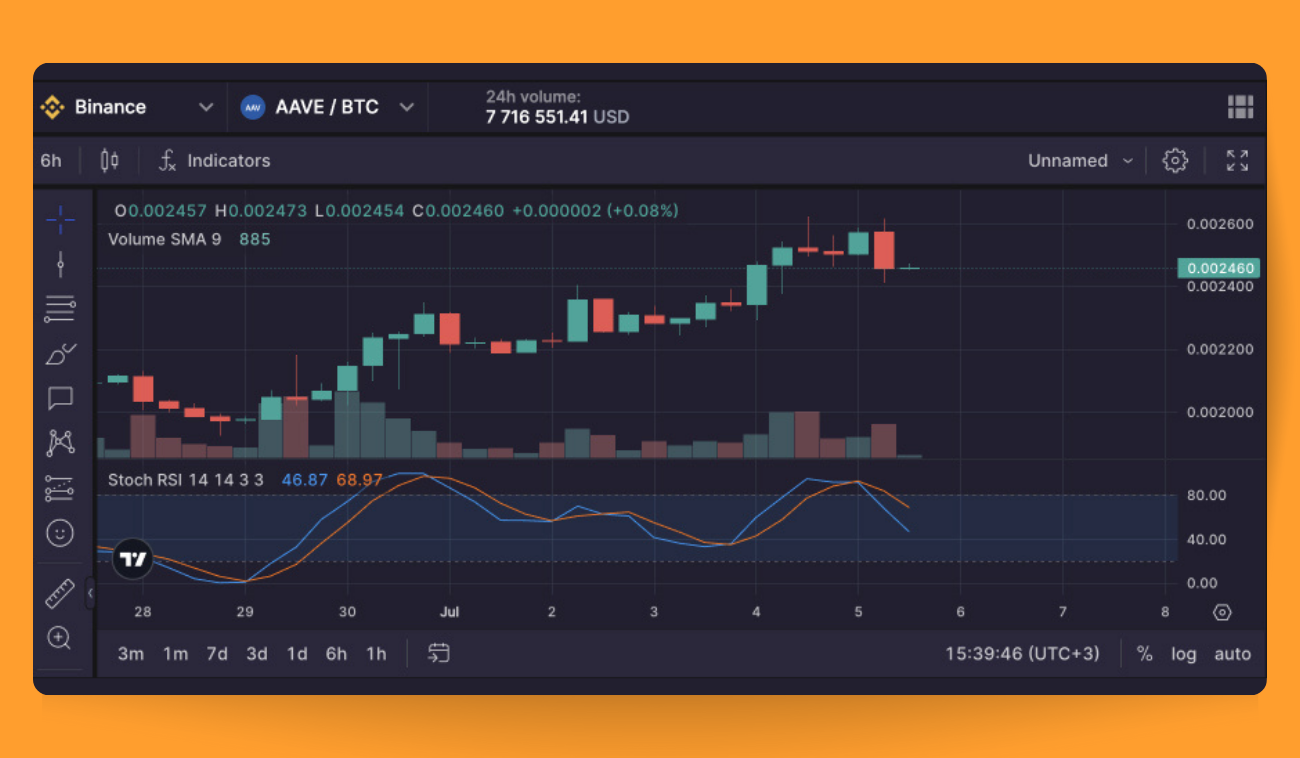
Beyond unmasking overbought and oversold conditions, Stoch RSI can help you spot short-term trends by viewing it as an oscillator with a center stage at 50. When Stoch RSI rises above 50, the asset may be seen as strutting higher than its intrinsic value, and when it dips below 50, the performance could be taking a downturn.
What Is the Difference between Stoch and Stoch RSI?
The Stoch and Stoch RSI are both momentum indicators with a flair for helping traders spot overbought and oversold conditions in the market. While they share a common goal, their calculations and the data they use set them apart, giving them their unique characteristics.
The stochastic oscillator compares an asset’s closing price to its price range over a specified period. The idea is that in an upward-trending market, prices tend to close near their highs, while in a downward-trending market, prices gravitate towards their lows.
As discussed, two lines in Stoch are called %K and %D, where the %K line equals to 100 * (Current Close - Lowest Low) / (Highest High - Lowest Low)
In this equation, the "Lowest Low" is the lowest price during the specified period, and the "Highest High" is the highest price within the same timeframe.
The %D line is a simple moving average of the %K line, typically calculated over three periods.
The stochastic RSI, or Stoch RSI, is an offshoot of the RSI (Relative Strength Index). It's an oscillator that borrows the concept of the stochastic oscillator but applies it to RSI values rather than price data. This twist makes the Stoch RSI more sensitive and quick to react to market changes.
The Stoch RSI also features two lines, often referred to as K and D. The K line is crafted using the following formula: (RSI - Lowest Low RSI) / (Highest High RSI - Lowest Low RSI)
Here, the "Lowest Low RSI" is the lowest RSI value in the specified period, and the "Highest High RSI" is the highest RSI value within the same timeframe.
The D line is a simple moving average of the K line, usually calculated over three periods.
So, to sum up, these are the key differences between Stoch and Stoch RSI:
- Data sources: While the stochastic oscillator uses price data, the Stoch RSI grooves to RSI values.
- Sensitivity: The Stoch RSI is generally more sensitive and delivers more signals compared to the stochastic oscillator. This duality can be both a blessing (enhanced responsiveness) and a curse (increased false signals).
Examples of Stoch and Stoch RSI Indicators
Jimmy is curious about trading a specific cryptocurrency, but he's on the fence about whether it's the right time to buy or not. With so much activity buzzing around, he fears he might dive headfirst into a massive sell-off.
Determined to make an informed decision, Jimmy decides to enlist the help of Stoch to pinpoint the perfect buy-in moment. As he examines Bitsgap, he notices that the Stoch for his chosen asset is dipping below 20. This is fantastic news, and he starts to feel more confident that he's on the brink of making a great buy.
But Jimmy isn't one to leave things to chance. He decides to bring the Stoch RSI into the mix to gauge the strength of his other indicators. Lo and behold, the Stoch RSI for the asset is perched at 20, nestled within the range that signals a potentially golden opportunity to buy. With multiple indicators now echoing his initial thoughts, Jimmy feels ready to take the plunge and make his purchase, armed with the confidence of a well-informed trader.
Bitsgap: Charting & Indicator Tools + Trading Bots Galore
Bitsgap's TradingView interface equips you with a treasure trove of tools for conducting in-depth technical analysis.
As you know, technical analysis is the backbone of any successful trading strategy, helping you discover the best cryptocurrencies to trade, predict market movements, and pinpoint ideal entry and exit points for maximum profits.
The union of Bitsgap's intelligent trading and automation features with TradingView's charting tools is like a dream come true. Say goodbye to toggling between platforms—you'll find the best of both worlds in one seamless interface.
First up, it’s a stunning charting interface with drawing instruments nestled on the left-hand side and indicators at the top (Pic. 5):
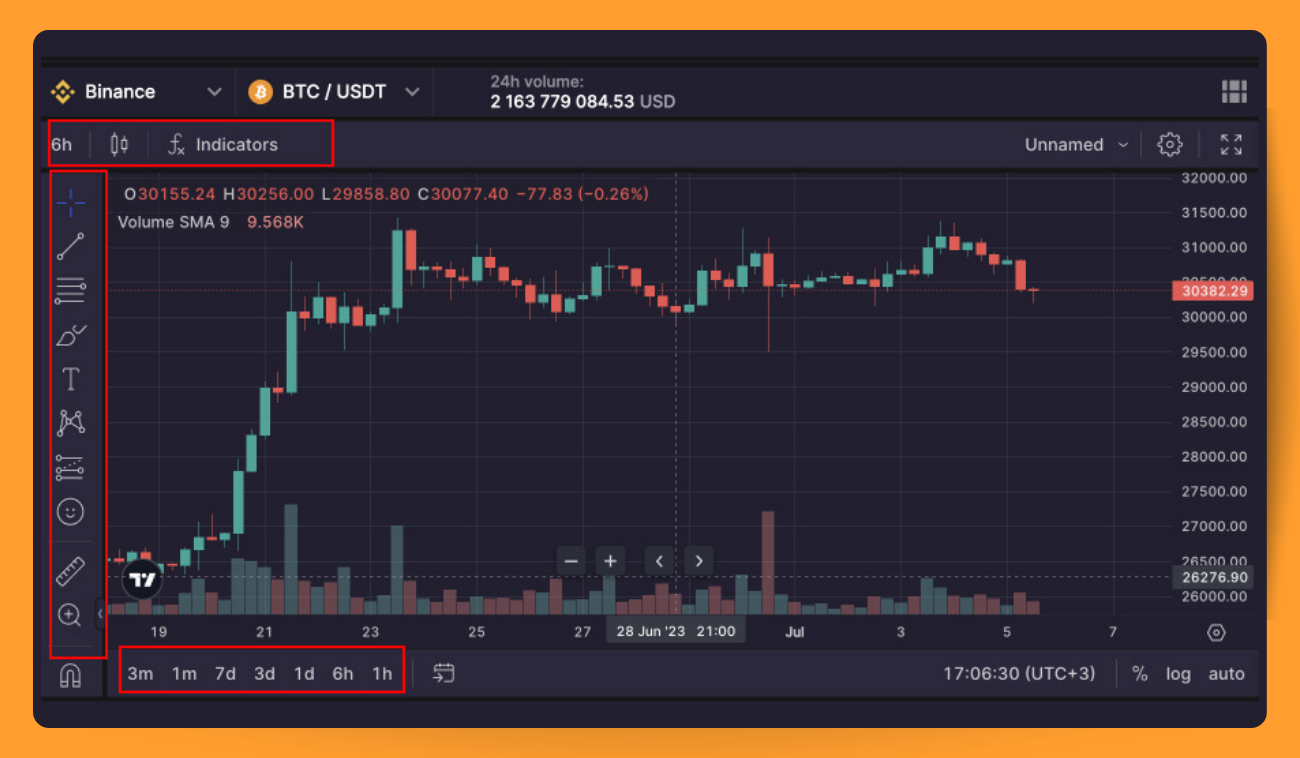
To pick an indicator, click on the [ƒx Indicators] icon and search for your desired indicator (Pic. 5). If you select multiple indicators, they'll be displayed one on top of the other at the bottom of the chart or directly on the chart itself.
Time intervals can be accessed at both the top and bottom of the interface. To view the six-hour chart, for example, choose [6 hours] from the [Time interval] icon's drop-down menu.
What's not to love? Pick your chart type and favorite indicators, sketch trend lines and patterns, add emojis, and share your doodles with friends!
For tech-savvy traders, Bitsgap has crafted something truly special — the Technicals widget, located on the same [Trading] tab, at the bottom of the interface, beneath the Order book (Pic. 6).
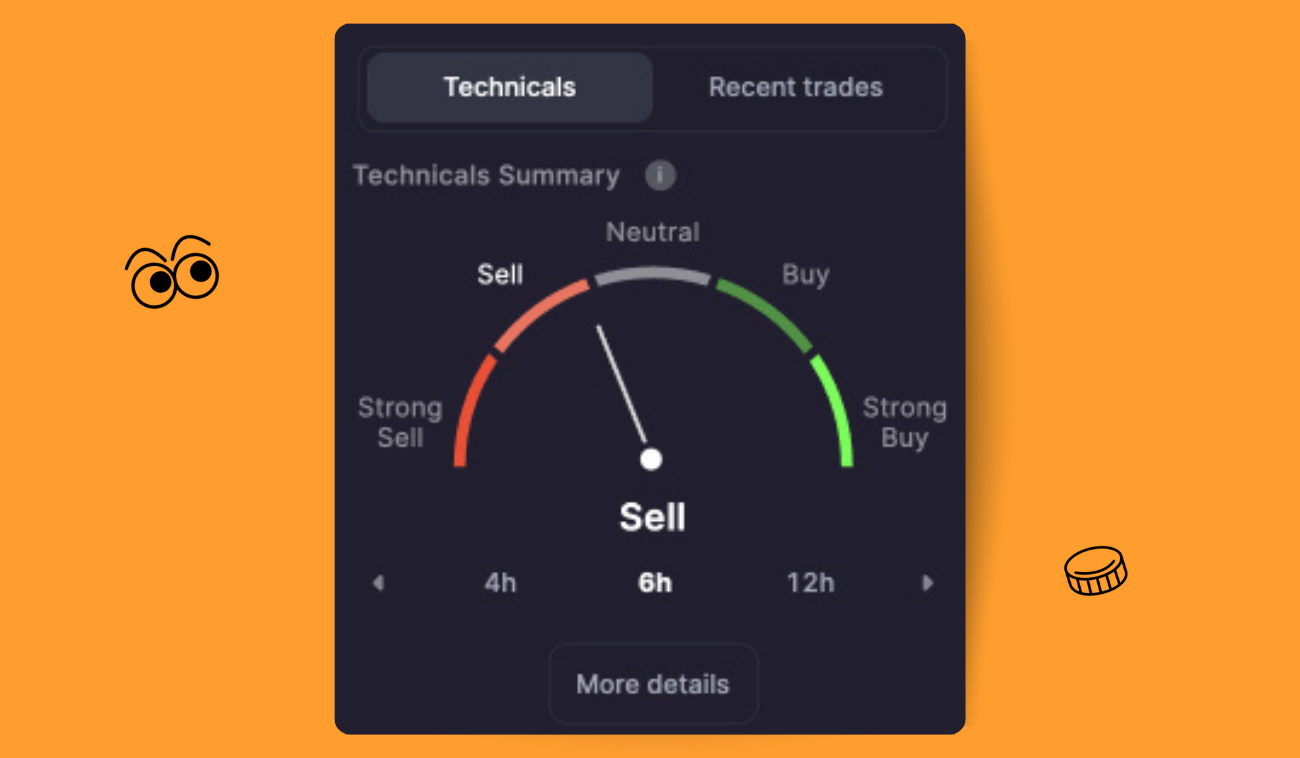
The Technicals widget meshes signals from a plethora of indicators and oscillators. It operates similarly to the Fear and Greed index, simplifying the process of uncovering lucrative trade opportunities by averaging signals from popular indicators.
No more fretting over checking each indicator separately—just monitor the Technicals widget or click on [More details] below it to review specific signals. To learn more about the widget, peruse this blog post.
Bitsgap doesn't stop there—it also flaunts advanced trading tools that most crypto exchanges lack, like smart orders (Scaled or TWAP) and trading bots (GRID, DCA, and COMBO). Explore how these tools work by browsing Bitsgap's Help Center at your leisure.
With over 3.7 million bots launched and $300 billion in trading volume in 2022 alone, Bitsgap’s bots have generated jaw-dropping returns and amassed a massive following.
The latest addition, DCA Futures, is a game-changer for futures trading. Its uncanny ability to maintain stability in volatile markets is nothing short of extraordinary. By consistently buying or selling assets at predetermined intervals, the bot adjusts your entry point in real-time, ensuring that even if your initial market prediction is off, your position will average out. This ultimately shifts the entry point to a more profitable level, making it easier to close the position with gains!
But Bitsgap is so much more than just trading bots! It also offers a super-secure trading environment with state-of-the-art security features and an unbeatable affiliate program, complete with massive rewards and prizes. So, go on, dive into the world of Bitsgap and experience the magic for yourself!
Bottom Line: STOCHRSI vs RSI – Which One Is Better?
It's challenging to determine which indicator is superior, as the Stoch and Stoch RSI provide different insights. One could argue that the Stoch RSI measures the strength of the regular RSI. However, since the Stoch RSI is an offshoot of the RSI, the RSI is actually more closely linked to the crypto asset's actual price.
With this in mind, you might want to consider using both indicators and comparing their results to draw more well-rounded conclusions. Relying solely on the Stoch RSI could sometimes lead to discrepancies that could throw off your calculations.
Remember, it's crucial not to put all your eggs in one basket when it comes to trading signals, as no single indicator is foolproof. Incorporating multiple trading signals into your strategy can help you spot any blind spots or detect potential issues that might render your technical analysis incorrect. By diversifying your approach, you'll be better equipped to navigate the ever-changing world of crypto trading.
FAQs
How to Use Stochastic RSI in Crypto: Stoch RSI Strategy
Below are a few basic suggestions for a Stoch RSI strategy for cryptocurrency trading:
- Add the Stoch RSI oscillator to your chart. It typically has two lines — the fast K and the slow D — with common settings being a 14-period RSI and a 3-period smoothing.
- A Stoch RSI reading above 80 signals overbought conditions, while below 20 indicates oversold.
- Look for crossovers: bullish when K crosses above D in the oversold zone, and bearish when K crosses below D in the overbought zone.
- Exit when the K and D lines cross again, but in the opposite direction of your entry signal.
- Use stop-loss orders and proper position sizing to manage risk.
- Boost reliability by incorporating other technical indicators or chart patterns that align with Stoch RSI signals.
Where Can I Find Bitcoin Stochastic RSI Live?
To find a live Bitcoin Stochastic RSI chart, you can use popular charting platforms and tools such as TradingView, Coinigy, CryptoCompare, or Bitsgap. Just go to the trading terminal, select any BTC trading pair, and select Stoch RSI among the available indicators.