Crypto Wicks: Size Matters (or Does It?)
Crypto candlestick charts can seem like cryptic puzzles, but the wicks hold hidden clues to unlock profitable trades. Learn to read these subtle signals of market sentiment and gain an edge in your trading decisions.
Understanding candlestick wicks is like deciphering a secret language that reveals the market's hidden intentions. These wicks, those thin lines extending from the candle body, whisper tales of buying and selling pressure, hinting at potential price swings. The longer the wick, the louder the whisper, and the more significant its message.
Join us as we dive into the world of crypto candlesticks, focusing on the often-overlooked power of wicks. Learn what they mean, how to interpret their signals, and how to use this knowledge to make smarter trading decisions.
What Are Crypto Candles?
So, what exactly are crypto candles, and how can they help you in your trading journey?
Crypto candles are a type of financial chart used to represent the price movements of a cryptocurrency over a specific period. Each candlestick on the chart provides a visual summary of the asset's price action, including the opening, closing, high, and low prices within that period. This rich information helps traders quickly gauge market sentiment and potential future price movements.
Anatomy of a Candlestick
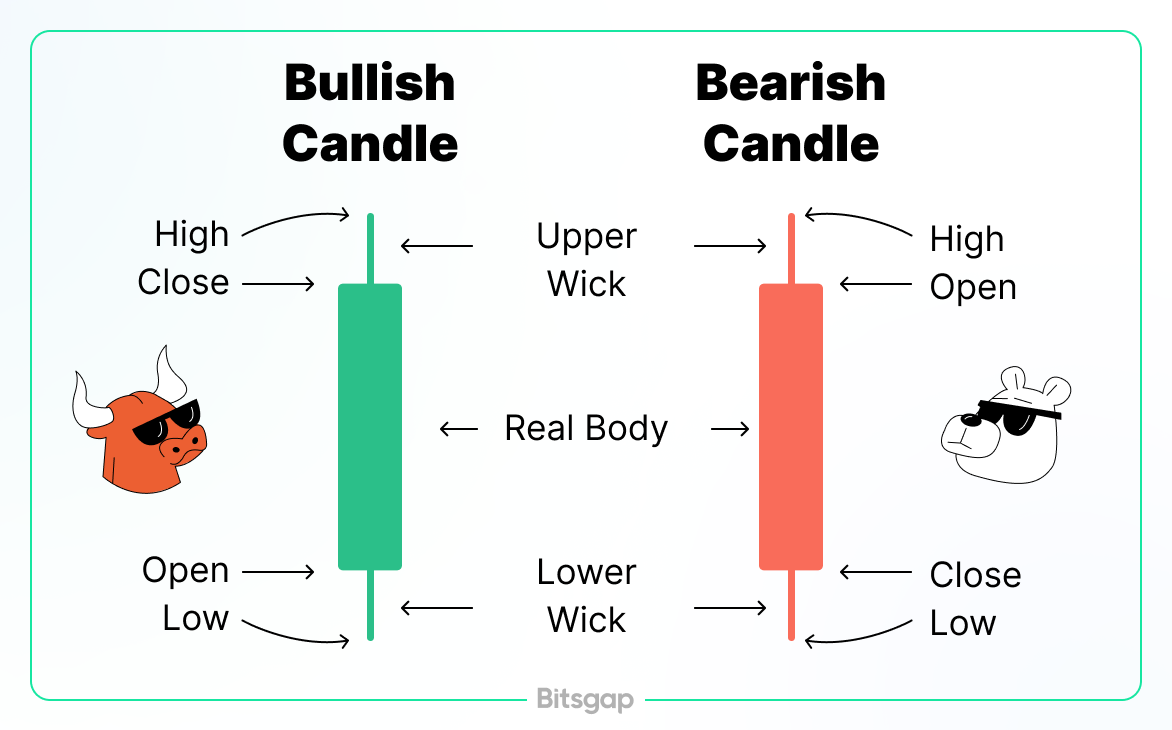
A single candlestick consists of the following components:
- The Body: This is the wide part of the candlestick and represents the range between the opening and closing prices. If the closing price is higher than the opening price, the body is typically colored green (or white), indicating a bullish market. Conversely, if the closing price is lower than the opening price, the body is colored red (or black), indicating a bearish market.
- The Wicks (or Shadows): These are the thin lines above and below the body. The upper wick represents the highest price reached during the period, while the lower wick shows the lowest price. The length of the wicks can provide insights into market volatility and trader sentiment.
Time Frames
Candlestick charts can be displayed over various time frames, ranging from one minute to one month or more. Each candlestick corresponds to the chosen time frame. For example, on a daily chart, each candlestick represents one day of trading activity. Selecting different time frames allows traders to analyze short-term and long-term trends.
Patterns and Their Significance
Candlestick patterns are crucial in technical analysis. Traders look for specific formations that can indicate potential market reversals or continuations. Some common patterns include:
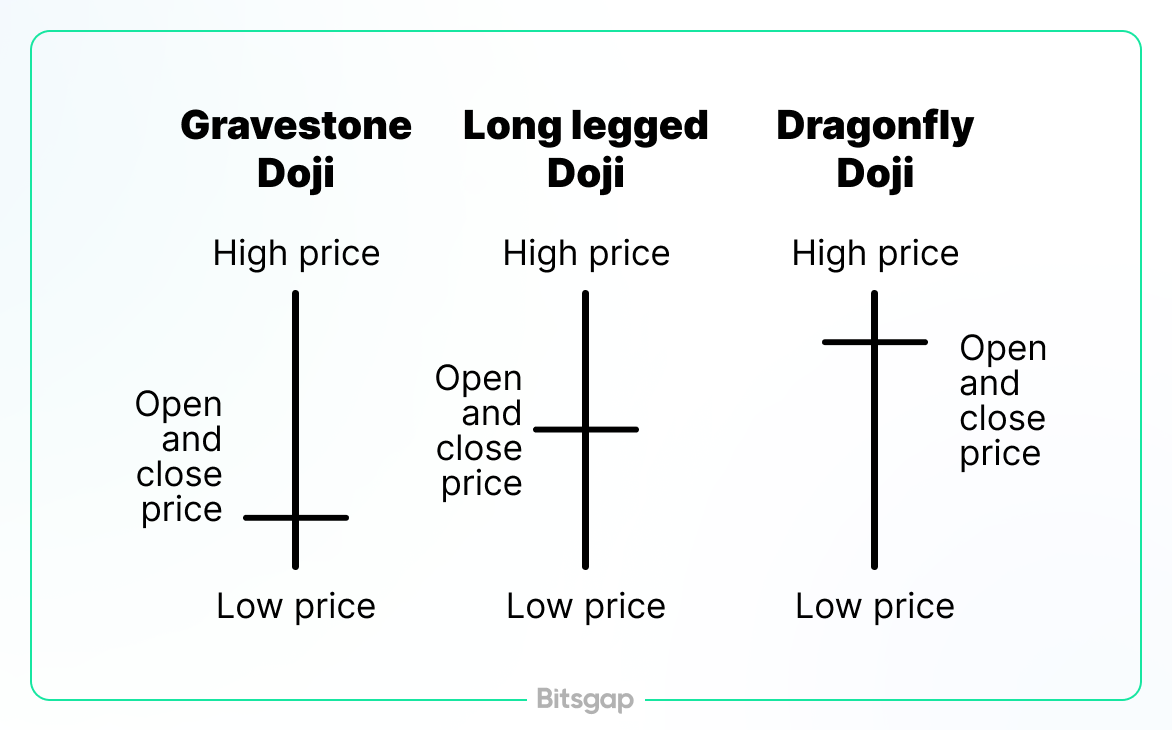
- Doji: A candlestick with a very small body, indicating indecision in the market. It often signals a potential reversal.
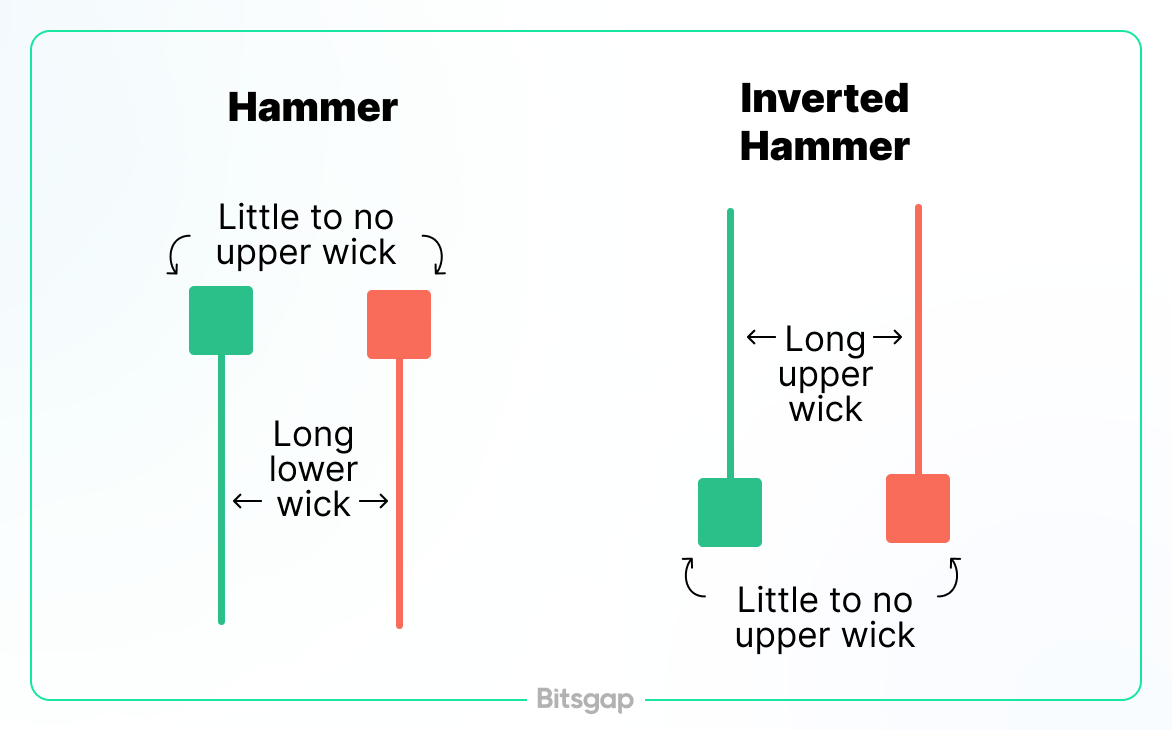
- Hammer: A candlestick with a small body and a long lower wick, suggesting that buyers are starting to gain control after a downward trend.
- Engulfing: A pattern where a small candlestick is followed by a larger one that completely engulfs the previous candle's body, indicating a possible reversal.
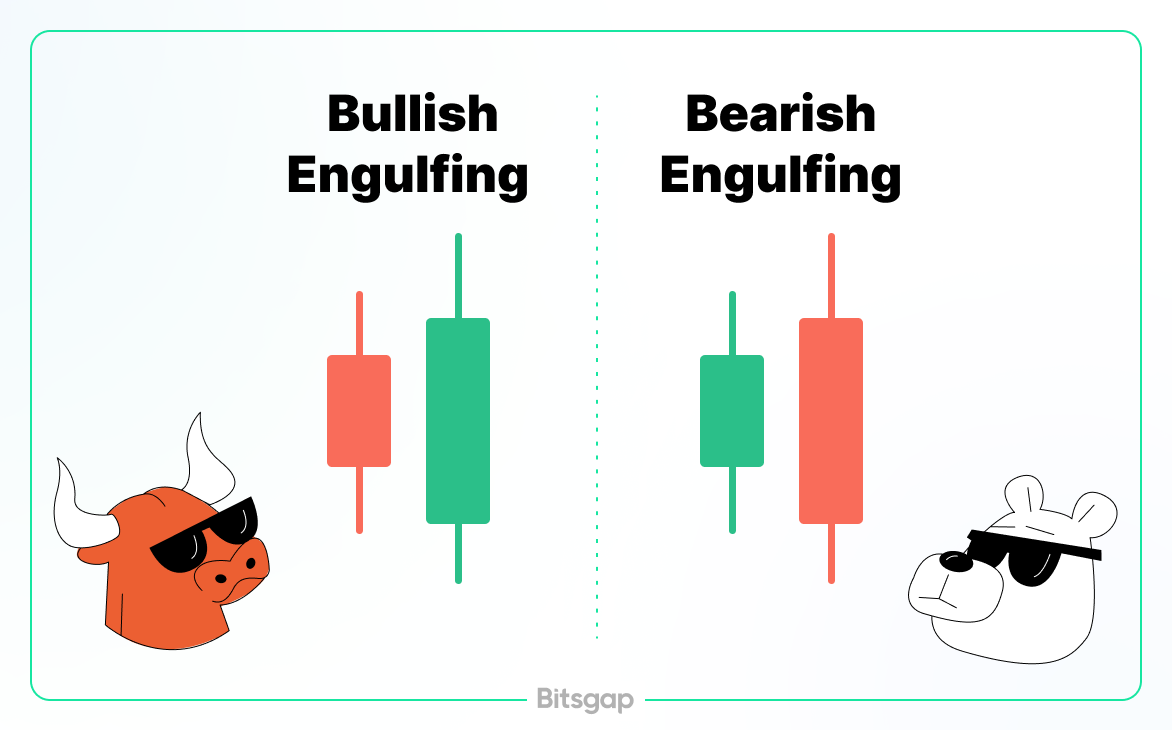
👉 Learn more about crypto candle patterns here: How to Read Crypto Candles and Use Them for Profitable Trading
Why Use Crypto Candles?
Crypto candles offer several advantages for traders:
- Visual Clarity: They provide a clear visual representation of price movements and market sentiment.
- Detailed Information: Each candlestick contains a wealth of information about price action within a specific period.
- Pattern Recognition: Identifying candlestick patterns can help predict future price movements and inform trading strategies.
Types of Candle Crypto Wicks
As mentioned, a candlestick wick represents the highest and lowest prices reached during a specific trading period. The upper wick extends above the body of the candlestick, indicating the highest price, while the lower wick extends below the body, showing the lowest price. The length and position of these wicks can reveal much about the market's behavior and potential future movements.
Types of Crypto Candle Wicks
- Long Upper Wick
- Description: A long upper wick, also known as a long upper shadow, indicates that the price reached a high point during the trading period but then fell back closer to the opening or closing price.
- Significance: This suggests that there was significant selling pressure at higher prices. It often signals a potential reversal or resistance level as sellers push the price down after a rally.
- Long Lower Wick
- Description: A long lower wick, or long lower shadow, shows that the price dropped to a low point during the trading period but then recovered to close near the opening or closing price.
- Significance: This indicates strong buying pressure at lower prices. It can signal a potential reversal or support level as buyers push the price back up after a decline.
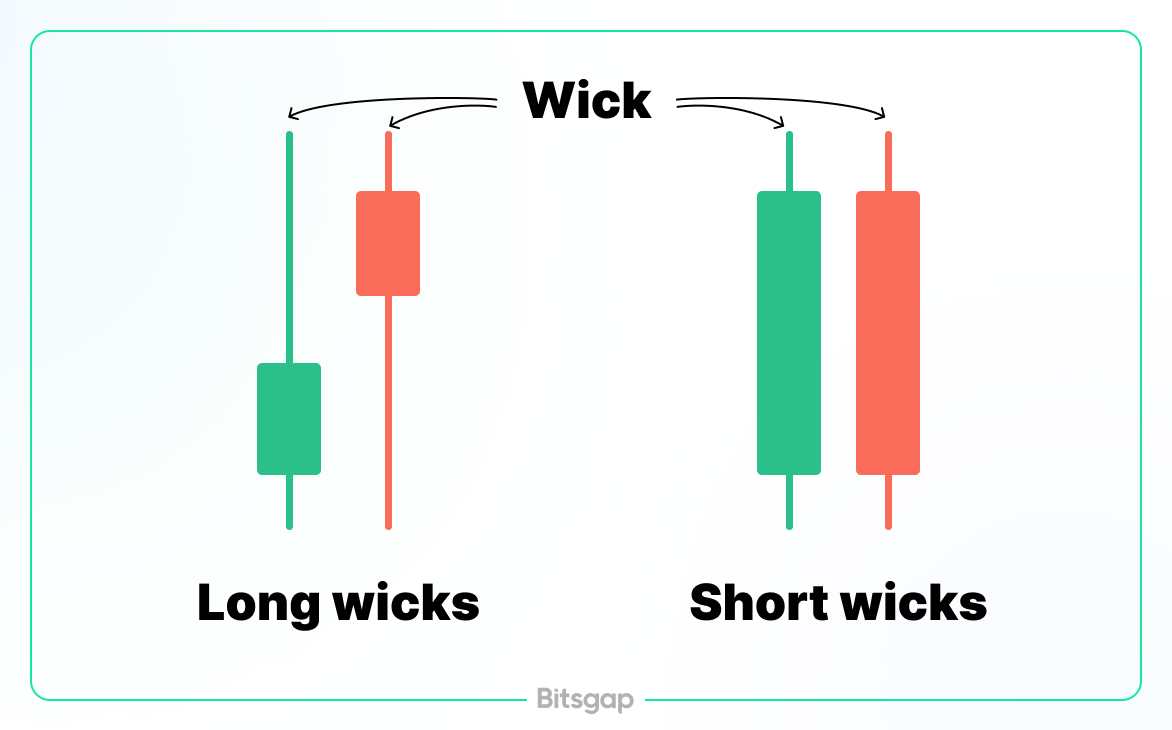
- Short Wicks
- Description: Short wicks, both upper and lower, indicate that the price did not move far from the opening and closing prices during the trading period.
- Significance: This suggests low volatility and indecision in the market. It often represents a period of consolidation where neither buyers nor sellers have a dominant influence.
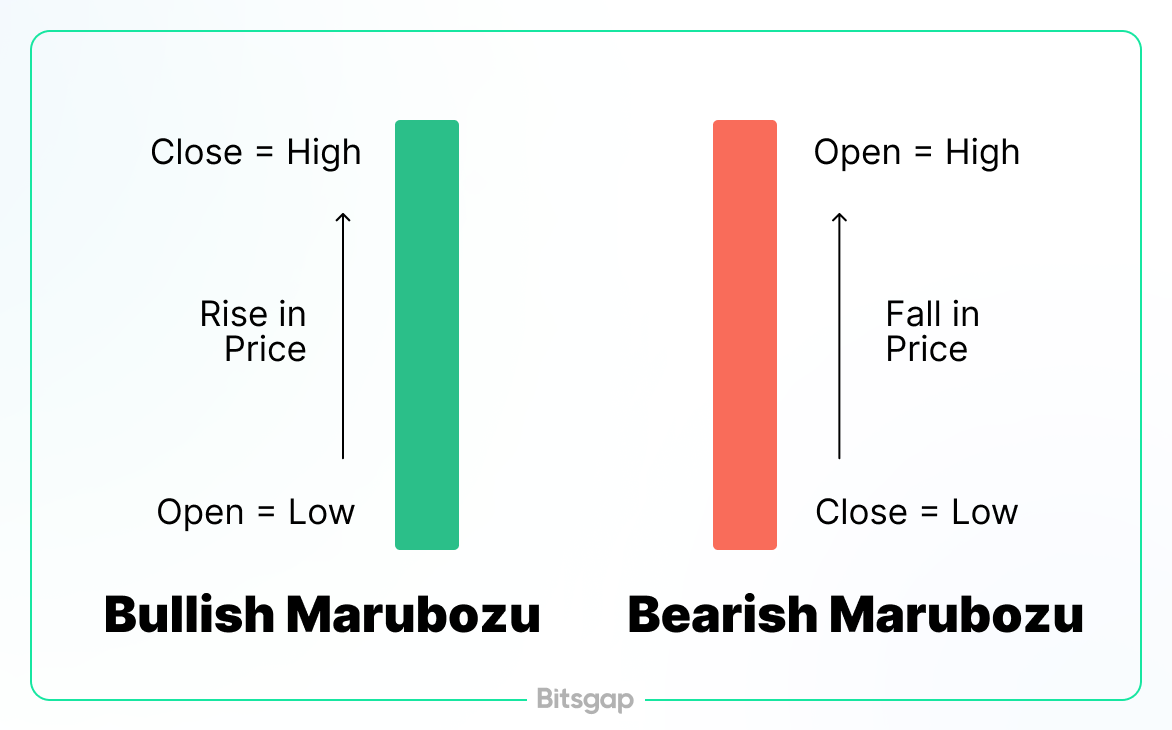
- No Upper or Lower Wick
- Description: When a candlestick has no upper or lower wick, it means the highest and lowest prices are the same as the opening or closing prices. This type of candlestick is called a Marubozu.
- Significance: A bullish Marubozu (no wicks, only a body) indicates strong buying pressure throughout the period, while a bearish Marubozu (no wicks, only a body) indicates strong selling pressure.
- Equal Upper and Lower Wicks
- Description: Candlesticks with equal-length upper and lower wicks show that the price moved equally in both directions from the opening or closing price during the trading period.
- Significance: This suggests a balanced tug-of-war between buyers and sellers. It often signals indecision and can precede a market reversal or continuation, depending on the context of the surrounding candles.
Differences Between the Types of Wicks
The primary differences between the types of crypto candle wicks lie in their length and position relative to the body of the candlestick:
- Length: Longer wicks indicate higher volatility and stronger buying or selling pressure, while shorter wicks suggest lower volatility and market indecision.
- Position: The position of the wick (upper or lower) indicates whether buyers or sellers were more active during the trading period. Long upper wicks point to selling pressure at higher prices, whereas long lower wicks indicate buying pressure at lower prices.
Why Are Candles Crypto Wicks Important?
Understanding why crypto candle wicks are important can enhance your trading strategy and improve your market analysis.
Revealing Market Sentiment
Crypto candle wicks are powerful indicators of market sentiment. The length and position of the wicks can tell you whether buyers or sellers were more dominant during a trading period. For example:
- Long Upper Wicks: These indicate that sellers were able to push the price down after it reached a high, suggesting selling pressure and potential resistance levels.
- Long Lower Wicks: These show that buyers drove the price back up after it dropped to a low, indicating buying pressure and potential support levels.
By analyzing the wicks, traders can gain a clearer picture of who has the upper hand in the market—buyers or sellers.
Indicating Price Volatility
The length of the wicks is a direct reflection of price volatility. Long wicks signify significant price movements within the trading period, while short wicks indicate relatively stable prices. Understanding this volatility is crucial for traders:
- High Volatility: Long wicks suggest that the market experienced large price swings, which can be an opportunity for traders looking to capitalize on short-term movements.
- Low Volatility: Short wicks indicate a more stable market, which might be preferred by traders seeking less risky environments.
Identifying Potential Reversals
Crypto candle wicks can also signal potential market reversals. Certain candlestick patterns, characterized by specific wick formations, can indicate that a trend is about to change direction. For example:
- Hammer and Hanging Man: A long lower wick with a small body at the top (hammer) can signal a bullish reversal in a downtrend. Conversely, a similar formation at the top of an uptrend (hanging man) can indicate a bearish reversal.
- Shooting Star and Inverted Hammer: A long upper wick with a small body at the bottom (shooting star) can indicate a bearish reversal in an uptrend, while its counterpart (inverted hammer) can signal a bullish reversal in a downtrend.
Recognizing these patterns allows traders to anticipate and act on potential reversals, improving their trading outcomes.
Enhancing Risk Management
Understanding the information conveyed by crypto candle wicks can enhance risk management strategies. For instance:
- Setting Stop-Loss Levels: Traders can use wick lengths to set more informed stop-loss levels. Long wicks might suggest placing stop-loss orders slightly beyond the wick's end to avoid getting stopped out prematurely.
- Adjusting Trade Size: In highly volatile markets indicated by long wicks, traders might reduce their trade size to manage risk better.
By incorporating wick analysis into their risk management plans, traders can protect their investments more effectively.
Bitsgap’s Charting & Other Trading Tools
If you’re looking for a crypto trading platform that has advanced charting capabilities and trading tools like smart orders and automations, then consider Bitsgap.
Bitsgap’s intuitive charting interface puts you in the driver's seat. Choose from a wide array of indicators, timeframes, and chart types to customize your view. Need to draw trendlines, support and resistance levels, or Fibonacci retracements? Our comprehensive drawing tools have you covered. For a deep dive into the charting interface, check out our dedicated article on Bitsgap's built-in TradingView integration.
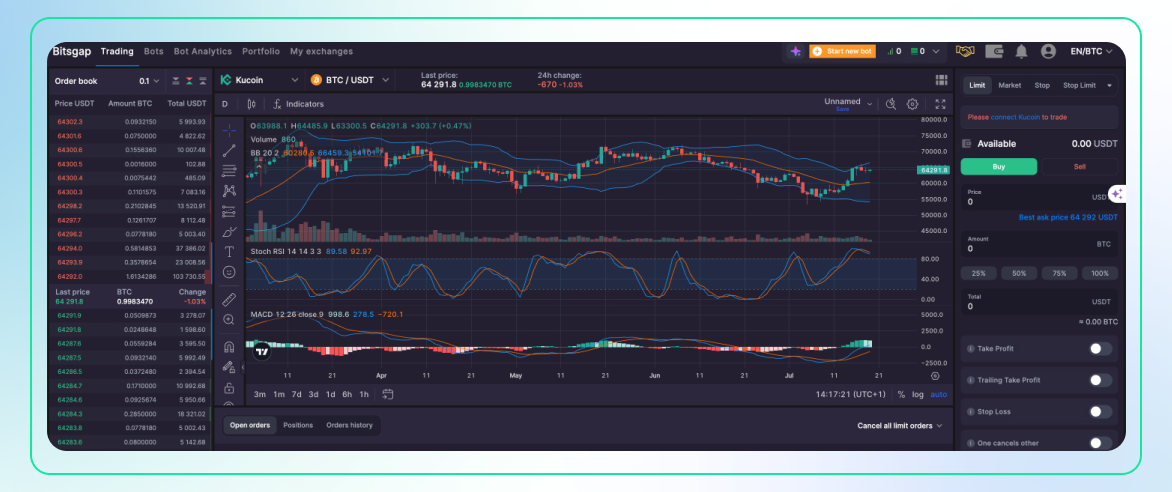
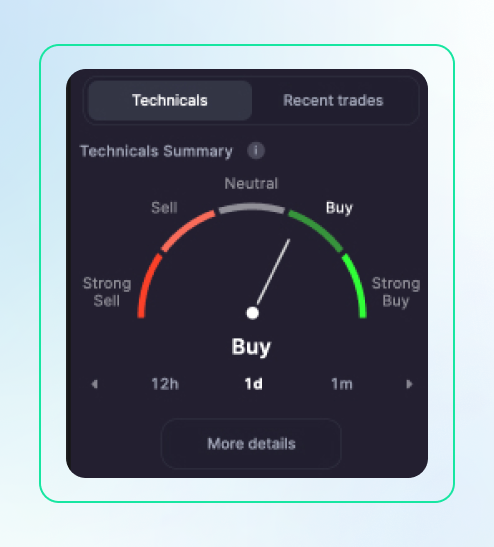
But that's not all! Bitsgap's Technicals Widget acts as your personal market sentiment analyst. This powerful tool crunches data from dozens of indicators and oscillators, providing you with a clear picture of the market's mood. You'll find this invaluable widget conveniently located right under the order book.
Ready to put your analysis into action? Bitsgap offers a suite of automated trading tools, including GRID, DCA, and BTD bots for the spot market and DCA Futures and COMBO for the futures market. While automated tools are not a substitute for your own research, they can be powerful allies in your trading journey. Combine your insights with indicator-based trading strategies, and you'll be well on your way to maximizing returns and minimizing risks. Try it out today!
Conclusion
Crypto candle wicks are essential tools for traders looking to understand market dynamics and make informed decisions. They provide valuable insights into market sentiment, price volatility, potential reversals, and risk management. By paying close attention to the length and position of candle wicks, traders can gain a deeper understanding of market behavior and improve their trading strategies. Whether you're a novice or an experienced trader, mastering the interpretation of crypto candle wicks can significantly enhance your ability to navigate the cryptocurrency market.
