Best Volatility Indicators for Crypto Trading
Cryptocurrencies' extreme volatility, with double-digit price swings within hours, attracts and intimidates investors alike. Discover what drives this volatility and how to measure and leverage it effectively.
Few investment arenas rival the white-knuckle volatility of cryptocurrencies, which routinely experience double-digit price swings on an hourly basis. But rather than deter investors, this radical unpredictability fuels fascination with surging coins like Bitcoin and Ethereum. Still, the extreme turbulence gives pause to many interested newcomers. What exactly drives such intense volatility able to transform portfolios overnight for better or worse? How can one effectively measure crypto volatility and leverage it to their advantage? In this article, we’ll explore these questions and more.
What Is Crypto Volatility and Why Is Crypto Volatile?
Cryptocurrency volatility is the propensity of prices for digital currencies to undergo swift and sizable fluctuations within brief spans of time. In this section, we’ll review the underlying reasons for crypto volatility as well as examine the numerous elements at play in fostering it.
Factors contributing to volatility of cryptocurrency:
- Market Sentiment:
- News and Media Coverage: Positive or negative news can significantly impact investor perception and lead to rapid price changes. For instance, regulatory news, technological advancements, or security breaches can cause sharp price movements.
- Investor Behavior: The market is heavily influenced by speculation. Fear of missing out (FOMO) and panic selling often drive rapid price swings.
- Market Maturity:
- Relative Immaturity: Compared to traditional financial markets, the cryptocurrency market is relatively young and less stable. This immaturity leads to higher volatility as the market is still finding its footing.
- Lack of Established Valuation Metrics: Unlike stocks or bonds, cryptocurrencies do not have widely accepted methods for valuation, making their prices more susceptible to speculation.
- Liquidity:
- Market Liquidity: Cryptocurrencies often have lower liquidity compared to traditional assets. This means that large trades can significantly impact the market price, leading to volatile price movements.
- Exchange Variability: Different exchanges may have varying liquidity levels, which can contribute to price discrepancies and volatility.
- Regulatory Environment:
- Regulatory Uncertainty: The lack of a clear regulatory framework in many jurisdictions contributes to market instability. Announcements of potential regulations or bans can cause significant price fluctuations.
- Global Nature: Cryptocurrencies operate globally, and regulatory news from any part of the world can have a ripple effect on the market.
- Technological Factors:
- Network Updates and Forks: Changes in the underlying technology, such as upgrades or forks, can create uncertainty and affect prices.
- Security Vulnerabilities: Hacks and security breaches can erode confidence and lead to sudden market drops.
- Market Manipulation:
- Whale Activity: Large holders of cryptocurrencies, often referred to as "whales," can influence market prices through substantial buy or sell orders.
- Pump and Dump Schemes: Coordinated efforts to artificially inflate the price of a cryptocurrency before selling off at a profit can contribute to volatility.
👉 So, why is crypto volatile? To put it briefly, crypto volatility is driven by a combination of market sentiment, immaturity, liquidity issues, regulatory uncertainty, technological changes, and potential for manipulation. While this volatility can offer opportunities for significant gains, it also poses substantial risks, making it essential for investors to approach the cryptocurrency market with caution and a well-informed strategy.
What Are Crypto Indicators, and What Are the Best Crypto Indicators?
Crypto indicators are tools and metrics used by traders and investors to analyze the cryptocurrency market and make informed decisions. These indicators help predict price movements, identify market trends, and gauge the overall health of the market. They can be based on various data points, including price, volume, and other market-specific factors. In this section, we’ll take a look at some of the best crypto indicators and highlight those effective for measuring crypto volatility.
So, here are some of the best indicators for crypto trading commonly used by traders:
- Moving Averages (MA):
- Simple Moving Average (SMA): Calculates the average price over a specific period.
- Exponential Moving Average (EMA): Gives more weight to recent prices, making it more responsive to new information.
- Relative Strength Index (RSI): Measures the magnitude of recent price changes to evaluate overbought or oversold conditions. An RSI above 70 typically indicates overbought conditions, while below 30 indicates oversold conditions.
- Moving Average Convergence Divergence (MACD): A trend-following momentum indicator that shows the relationship between two moving averages of a cryptocurrency’s price. It consists of the MACD line, signal line, and histogram.
- Bollinger Bands: Consists of a middle band (SMA) and two outer bands that represent standard deviations away from the middle band. It helps to identify volatility and potential overbought or oversold conditions.
- Volume: Analyzing the trading volume can provide insights into the strength of a price movement. High volume during an uptrend indicates strong buying interest, whereas high volume during a downtrend indicates strong selling interest.
- Stochastic Oscillator: Compares a particular closing price of a cryptocurrency to a range of its prices over a certain period. It helps identify potential reversal points.
- Fibonacci Retracement: A technical analysis tool that uses horizontal lines to indicate areas of support or resistance at the key Fibonacci levels before the price continues in the original direction.
- On-Balance Volume (OBV): A momentum indicator that uses volume flow to predict changes in price. It shows the cumulative total of volume flowing in and out of a cryptocurrency.
Several of the indicators above can help gauge crypto volatility:
- Bollinger Bands: The width of the bands expands and contracts with volatility. Wider bands indicate higher volatility, while narrower bands indicate lower volatility.
- Moving Average Convergence Divergence (MACD): Large swings in the MACD can signal high volatility. When the MACD line crosses above the signal line, it indicates bullish momentum, and vice versa.
- Average True Range (ATR): Specifically designed to measure volatility. It calculates the average range between the high and low prices over a specific period. Higher ATR values indicate higher volatility.
- Volume: Sudden spikes in trading volume can indicate increased volatility. High volume during price movements suggests stronger conviction behind the move, leading to more significant volatility.
- Relative Strength Index (RSI): While primarily used to identify overbought or oversold conditions, extreme RSI values can also indicate periods of high volatility.
What Are Volatility Indicators?
Volatility indicators are tools used in technical analysis to measure the degree of variation in the price of an asset over a specific period. They help traders understand how much an asset's price is likely to fluctuate and can indicate periods of high or low volatility. These indicators can be crucial for making informed trading decisions, particularly in the cryptocurrency market, which is known for its high volatility.
What Are the Best Volatility Indicators for Crypto?
As previously noted, Bollinger Bands and Average True Range (ATR) can be highly effective for gauging volatility. However, there are additional volatility measures that merit an in-depth examination:
Volatility Index (VIX):
Description:
- The VIX, also known as the "Fear Index," is a real-time market index that represents the market's expectations of 30-day forward-looking volatility. It was originally developed for the S&P 500 by the Chicago Board Options Exchange (CBOE).
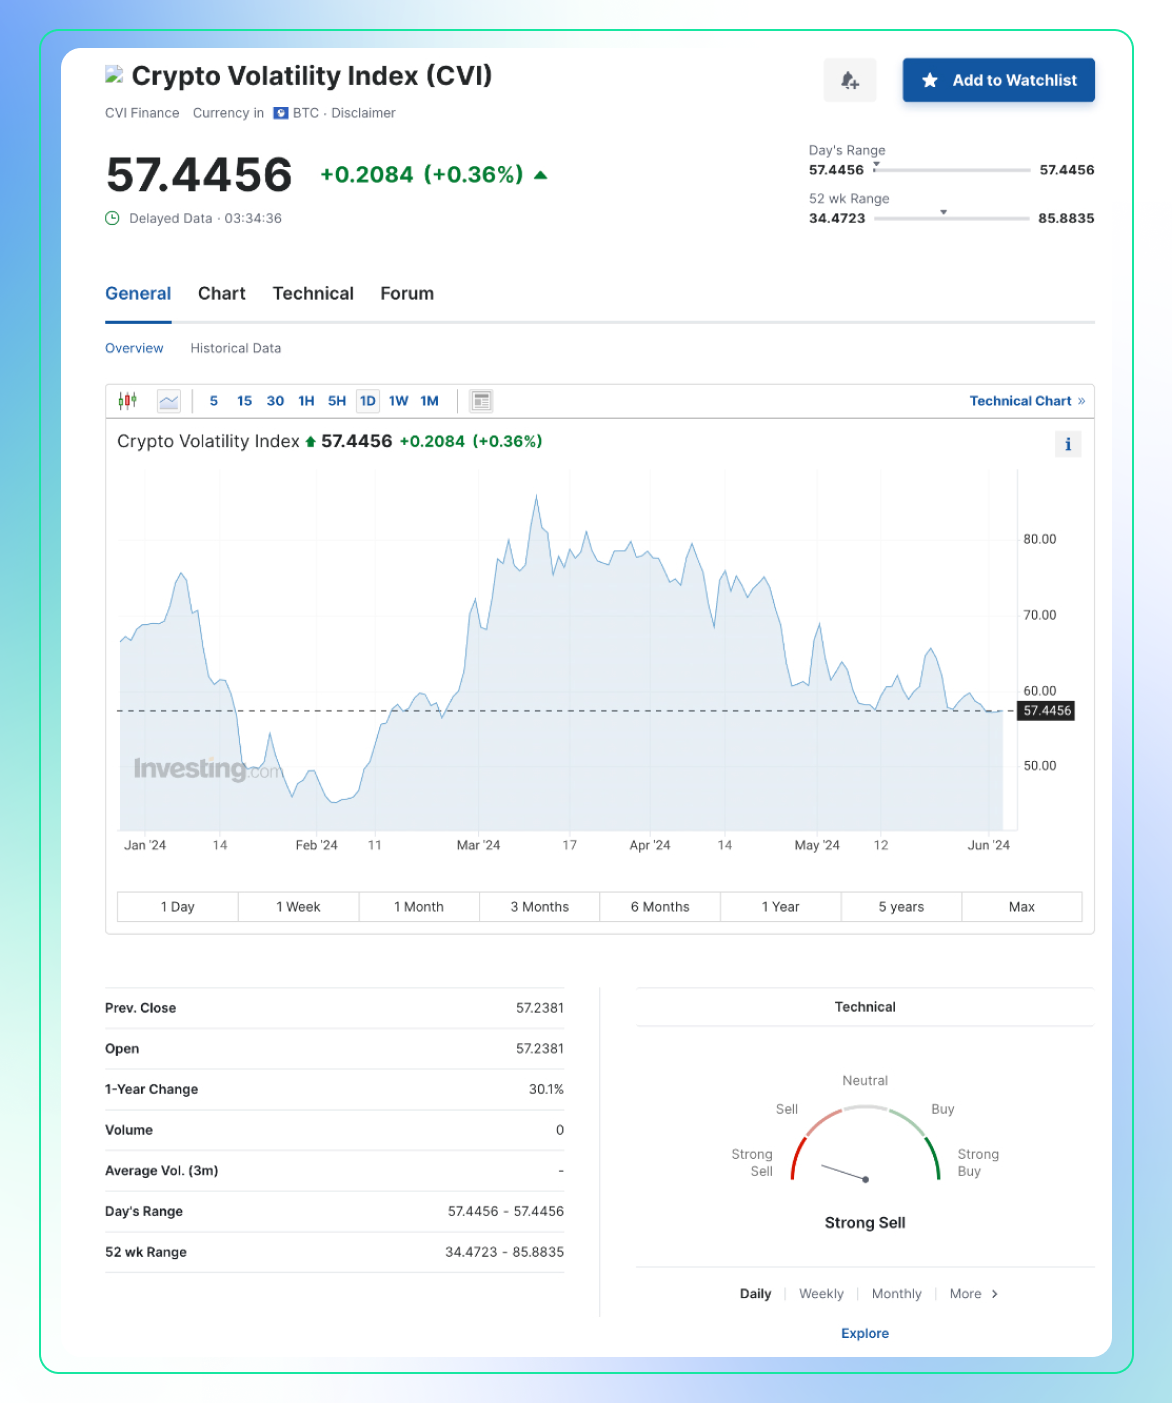
- In the context of cryptocurrencies, similar indices have been developed to measure expected volatility in the crypto market. These indices work by analyzing options prices, which reflect investor sentiment and expectations of future volatility. One such index is CVI:
Use:
- Market Sentiment Gauge: The VIX is often used to gauge investor sentiment and market expectations. A high VIX value indicates that investors expect significant price swings (high volatility), often due to uncertainty or fear in the market.
- Risk Management: Traders use the VIX to manage risk. During periods of high VIX, they might reduce exposure to riskier assets or use hedging strategies.
- Trading Signals: Some traders use the VIX as a contrarian indicator. Extremely high values may indicate panic selling and potential buying opportunities, while extremely low values may suggest complacency and potential for a market correction.
Standard Deviation
Description:
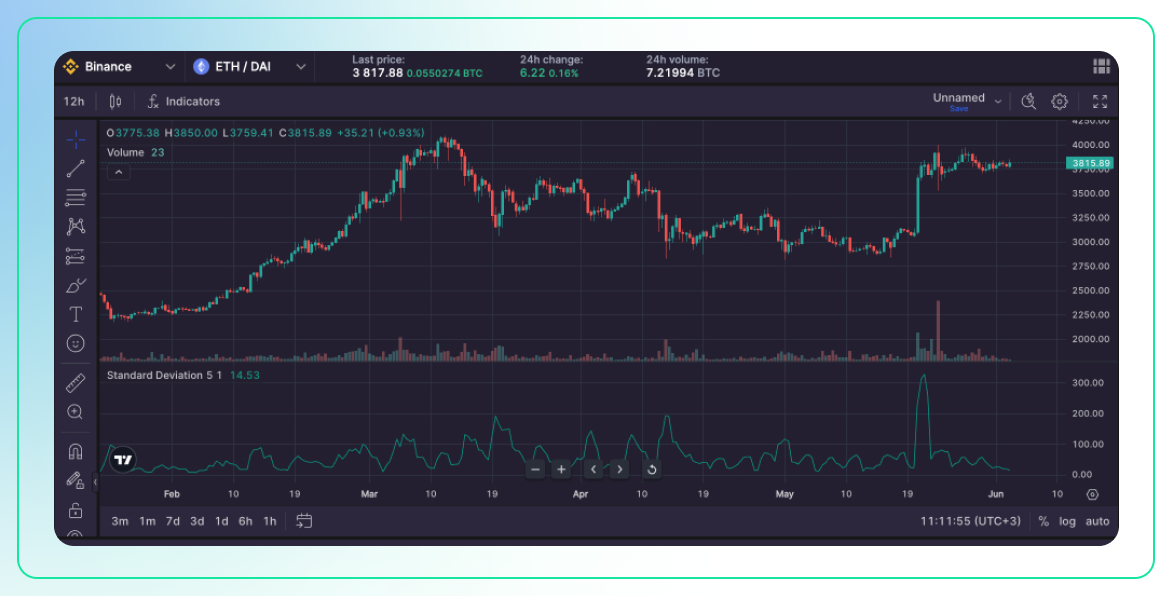
- Standard deviation is a statistical measure that quantifies the amount of variation or dispersion of a set of values. In trading, it measures the dispersion of price from its average over a specified period.
- A higher standard deviation indicates that prices are spread out over a larger range, which implies higher volatility.
Use:
- Volatility Measurement: Standard deviation is used to measure the volatility of an asset. Higher standard deviation values indicate higher volatility, while lower values indicate lower volatility.
- Risk Assessment: Traders use standard deviation to assess the risk of a particular asset. Higher volatility assets are generally considered riskier.
- Bollinger Bands Component: Standard deviation is a key component of Bollinger Bands, another popular volatility indicator.
Keltner Channels
Description:
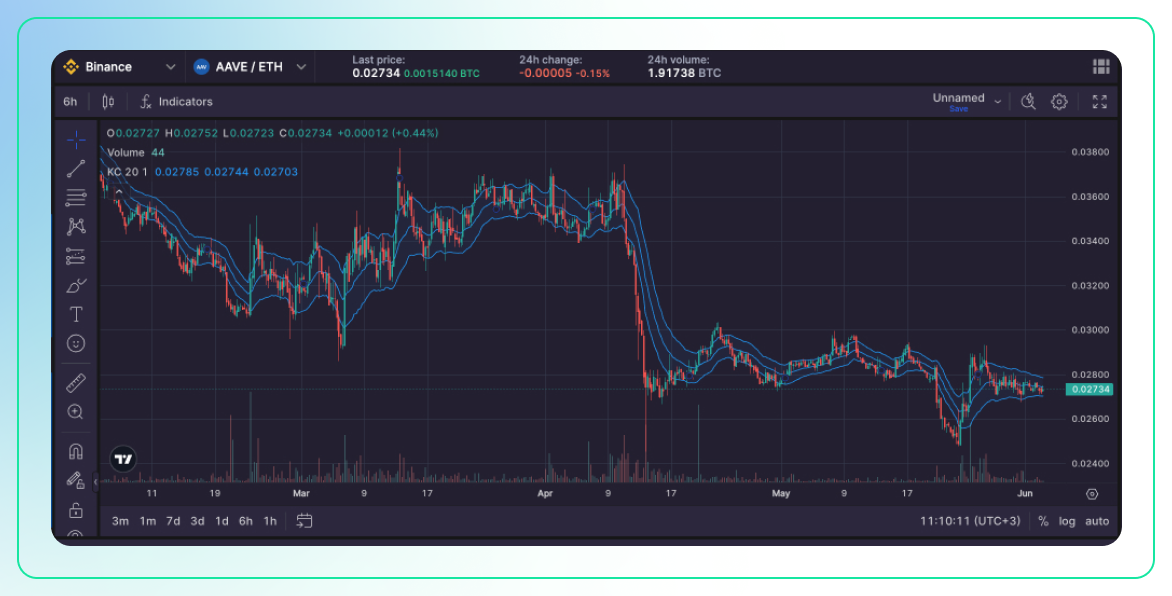
- Keltner Channels are volatility-based envelopes set above and below an exponential moving average (EMA) of an asset’s price. The distance of the channels from the EMA is determined by the average true range (ATR), which measures volatility.
- Unlike Bollinger Bands, which use standard deviation, Keltner Channels use ATR to set the band width.
Use:
- Identifying Overbought/Oversold Conditions: When the price moves outside the upper or lower bands, it may indicate overbought or oversold conditions, respectively.
- Trend Identification: Prices consistently touching or moving outside the upper band suggest a strong uptrend, while prices touching or moving outside the lower band suggest a strong downtrend.
- Volatility Assessment: The distance between the bands expands during high volatility periods and contracts during low volatility periods, helping traders gauge market conditions.
Choppiness Index
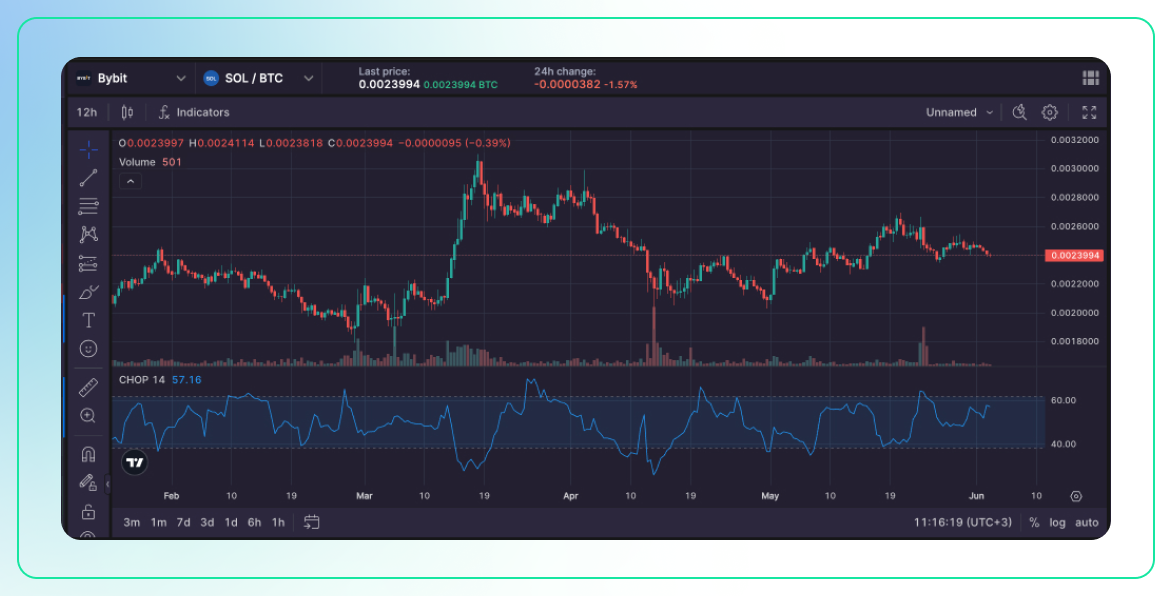
Description:
- The Choppiness Index is a technical indicator designed to determine whether the market is trending or choppy (trading sideways). It ranges from 0 to 100, with lower values indicating a trending market and higher values indicating a choppy, non-trending market.
- It does not indicate the direction of the trend but only the nature of the market movement.
Use:
- Market Condition Assessment: Traders use the Choppiness Index to assess market conditions. Low values suggest a strong trend, while high values suggest a lack of clear direction.
- Strategy Development: During choppy markets, range-bound strategies may be more effective, whereas trend-following strategies are better suited for trending markets.
- Volatility Insight: High Choppiness Index values can also imply higher volatility, as the market lacks a clear direction and prices fluctuate within a range.
Price Rate of Change (ROC)
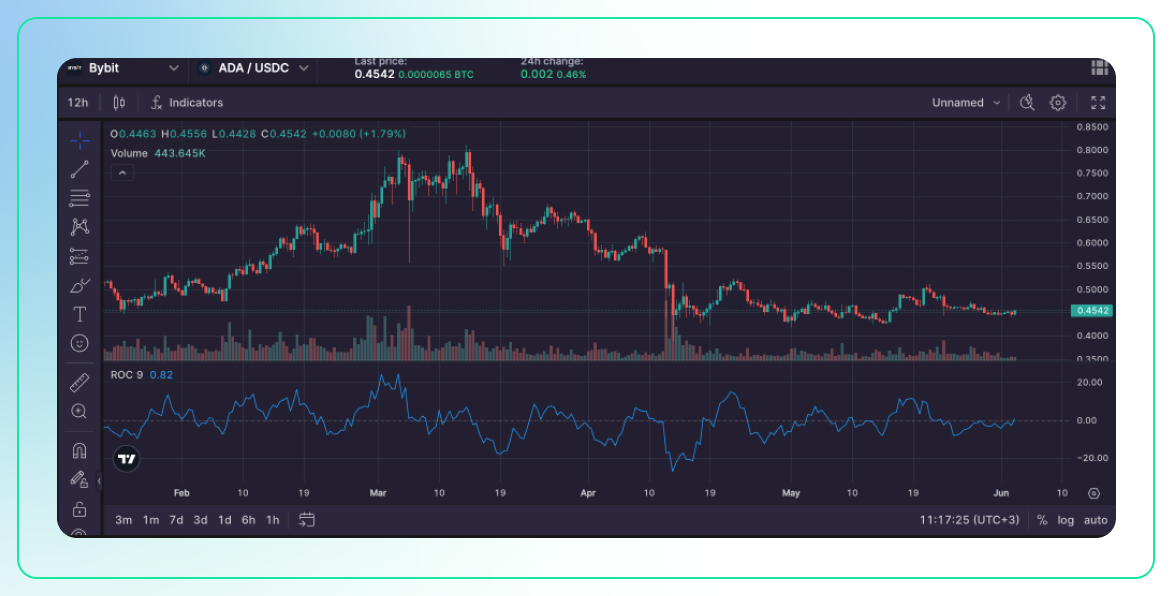
Description:
- The Price Rate of Change (ROC) is a momentum oscillator that measures the percentage change in price between the most recent price and the price a certain number of periods in the past.
- It is calculated by taking the difference between the current price and the price a certain number of periods ago, dividing by the price a certain number of periods ago, and multiplying by 100.
Use:
- Momentum Indicator: ROC helps identify the speed and magnitude of price movements. Positive ROC values indicate upward momentum, while negative values indicate downward momentum.
- Overbought/Oversold Conditions: Extremely high or low ROC values can indicate overbought or oversold conditions, signaling potential reversals.
- Volatility Assessment: Large swings in ROC values signal high volatility, helping traders anticipate significant price movements and adjust their strategies accordingly.
Volatility Close-to-Close
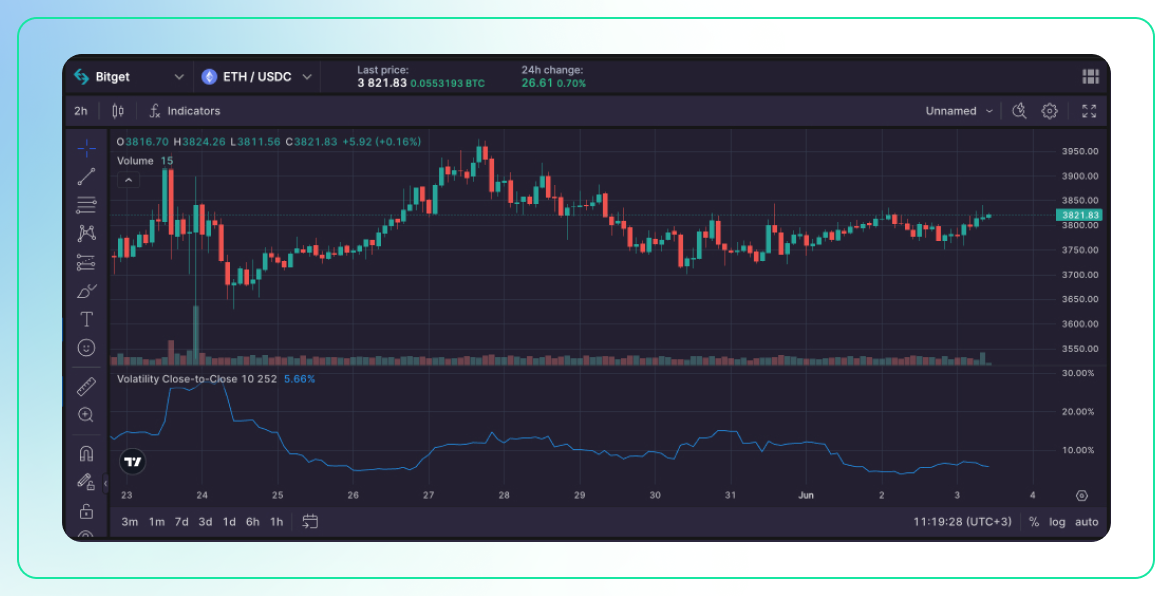
Description:
- This method calculates volatility based on the closing prices of consecutive trading periods. It focuses on the differences between the closing price of one period and the closing price of the next period.
- It is often expressed as an annualized standard deviation of these daily returns.
Use:
- Volatility Measurement: It provides a straightforward measure of how much the price of an asset fluctuates from one close to the next.
- Risk Assessment: Higher close-to-close volatility indicates greater uncertainty and risk, which can help traders adjust their strategies accordingly.
Volatility O-H-L-C
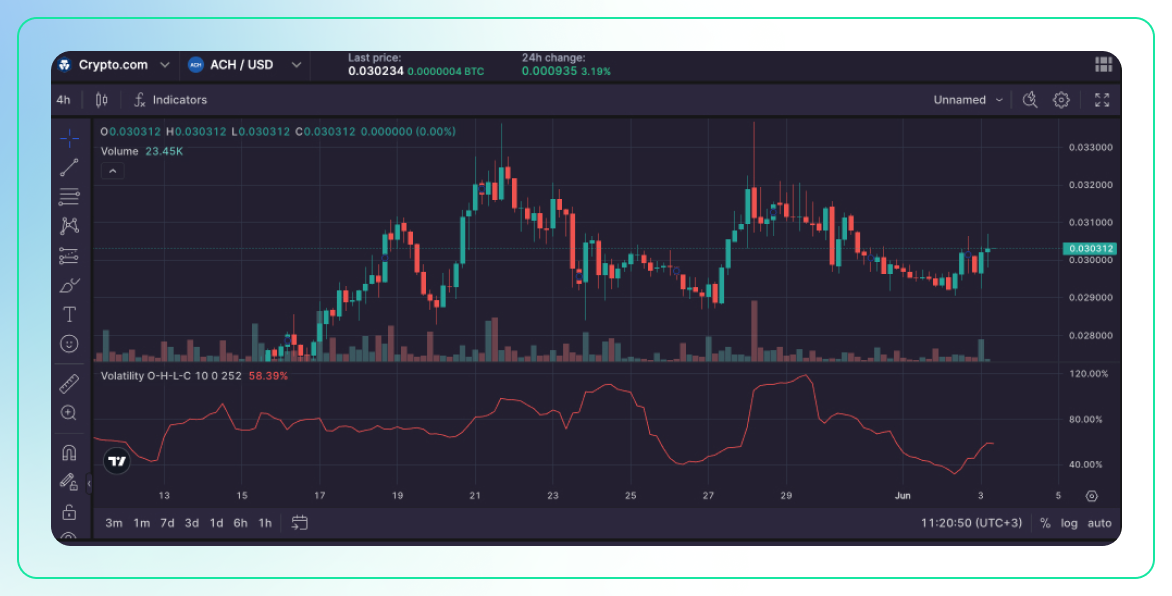
Description:
- This method takes into account the open, high, low, and close prices within a single trading period to measure volatility.
- The most common form of this measurement is the Parkinson’s volatility, which uses the high and low prices to estimate volatility more accurately than just using closing prices.
Use:
- More Comprehensive Volatility Measurement: By considering the full range of price movements within a period, it provides a more detailed picture of volatility.
- Risk Management: It helps in understanding the daily price range, which can be critical for setting stop-loss orders and other risk management tools.
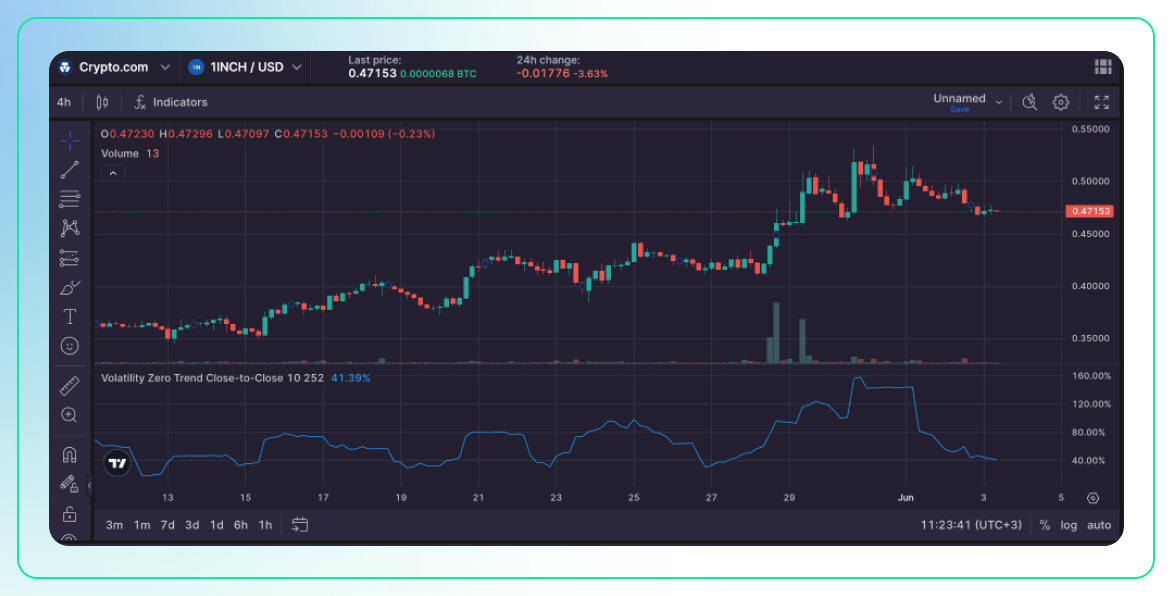
Volatility Zero Trend Close-to-Close
Description:
- This indicator measures volatility by comparing the closing prices of consecutive periods but adjusts for a zero trend, meaning it neutralizes the effect of a consistent upward or downward trend in the data.
- It focuses purely on the variability of prices around the average.
Use:
- Pure Volatility Measurement: By removing the trend, it provides a clearer measure of the inherent volatility in the price movements.
- Trading Strategy Adjustment: Traders can use this to adjust their strategies based on the underlying volatility without being influenced by the overall market trend.
Chaikin Volatility
Description:
- Developed by Marc Chaikin, this indicator measures the volatility of an asset by comparing the difference between the high and low prices over a specific period.
- It uses the exponential moving average (EMA) of the difference between high and low prices to smooth out the data.
Use:
- Volatility Assessment: It helps identify periods of increasing or decreasing volatility, which can signal potential breakouts or reversals.
- Market Timing: Traders use Chaikin Volatility to time entries and exits more effectively, particularly in conjunction with other indicators.
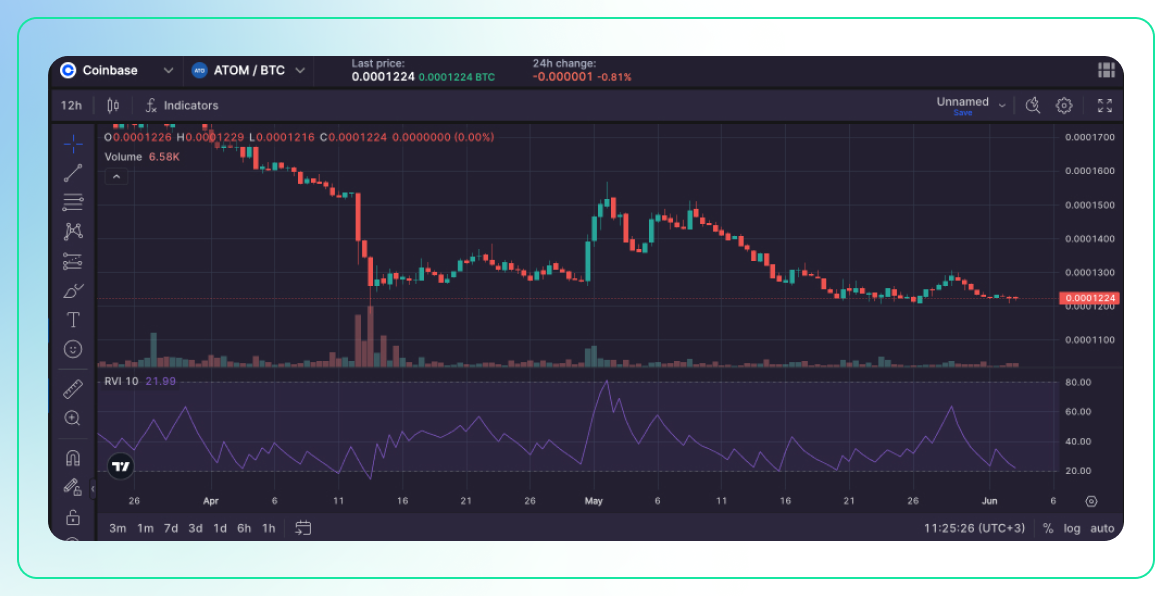
Relative Volatility Index (RVI)
Description:
- The Relative Volatility Index (RVI) is similar to the Relative Strength Index (RSI) but measures volatility instead of price momentum.
- It compares the average of the upward changes in price with the average of the downward changes in price over a specific period.
Use:
- Overbought/Oversold Conditions: Like the RSI, the RVI can indicate overbought or oversold conditions, helping traders identify potential reversal points.
- Volatility Trend Analysis: It provides insights into the volatility trend, which can be useful for confirming the strength of price movements.
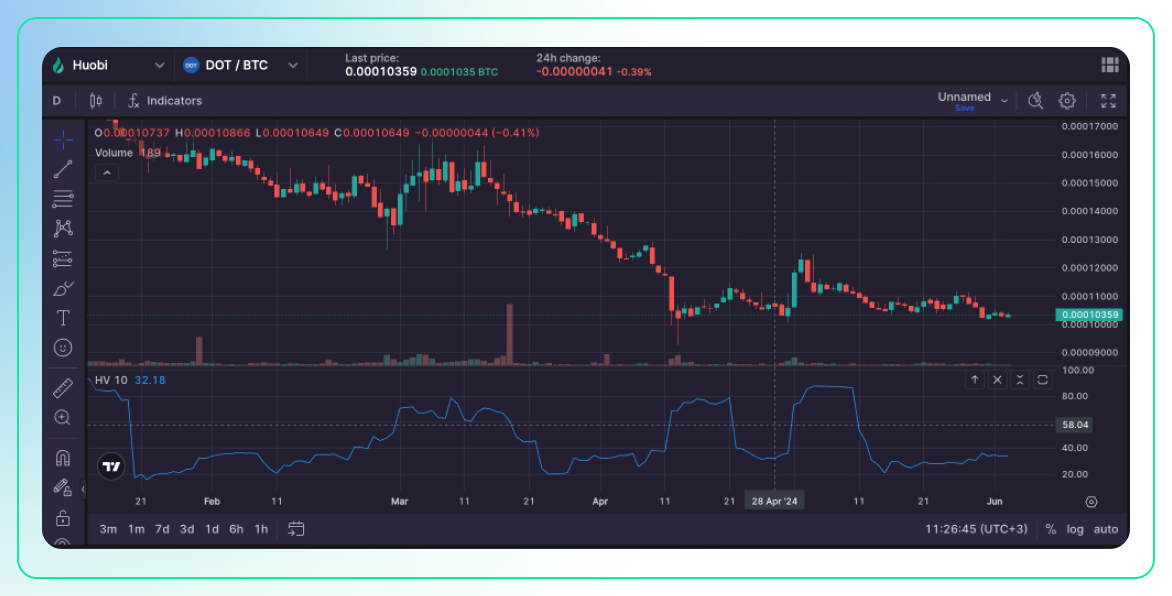
Historical Volatility
Description:
- Historical volatility measures the actual volatility of an asset’s price over a specific past period.
- It is typically calculated as the standard deviation of the logarithmic returns of the asset’s price over a specified time frame.
Use:
- Risk Assessment: Historical volatility provides a baseline for understanding an asset’s typical price fluctuations and can be used to gauge risk.
- Option Pricing: It is a critical input for pricing options and other derivatives, as it helps estimate the expected price range of the underlying asset.
- Comparative Analysis: Traders can compare current market conditions to historical volatility to assess whether the current environment is more or less volatile than usual.
Tools that measure crypto volatility provide essential insights into market dynamics, helping traders make better-informed decisions and manage risks more effectively. In the next section, we will examine how to interpret charts using these volatility indicators and see how they can evaluate volatility in live trading situations.
Technical Analysis with Volatility Indicators
Let's perform a technical analysis on the two provided charts, focusing on the volatility indicators and other technical signals.
Chart Analysis (First Chart: 30-minute interval)
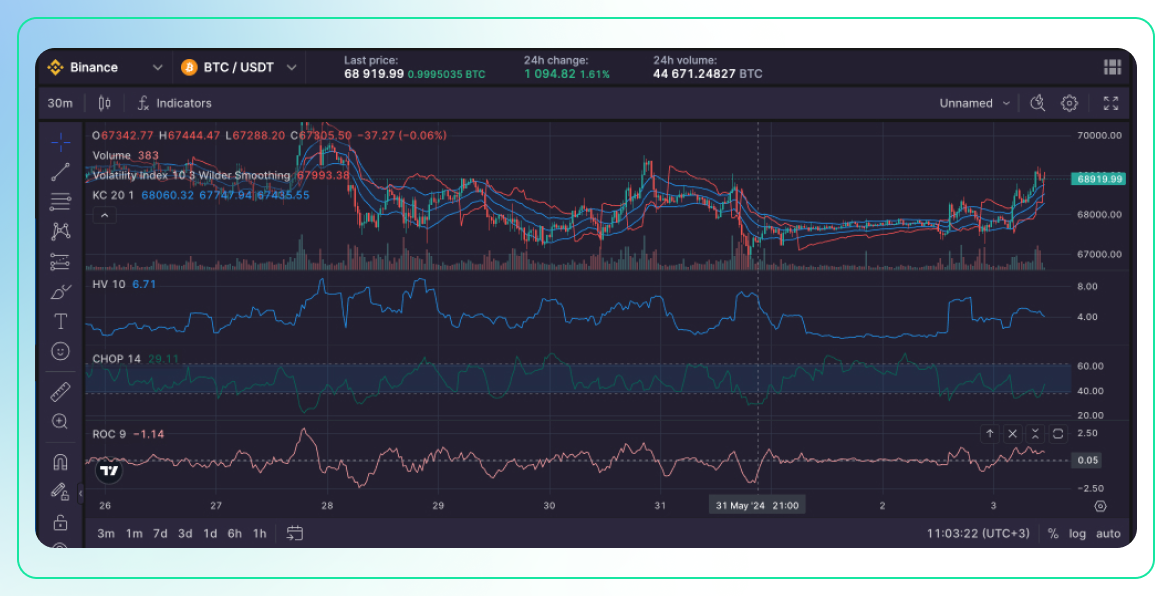
Examining the 30-minute interval chart for BTC/USDT, we observe that the price fluctuates between approximately 67,000 and 69,000. Towards the end of the chart, there is a slight upward trend, suggesting a potential shift in market sentiment. The volume remains relatively low and consistent, with no significant spikes that would indicate major buying or selling pressure. This implies that the market activity is stable without extreme volatility driven by high-volume trades.
The Volatility Index (VIX) is around 67,993.3, which is relatively high. This elevated VIX indicates increased market expectations of volatility, suggesting that traders are anticipating significant price movements. Such a high VIX often points to upcoming news or events that could impact market sentiment and lead to more pronounced price swings.
Analyzing the Keltner Channels, the price mostly oscillates within the bands, occasionally touching or slightly breaching the upper and lower limits. When the price touches the upper band, it may signal overbought conditions, while touching the lower band indicates oversold conditions. The price movement within these bands suggests a relatively stable trend with moderate volatility, as the price does not consistently break out of these boundaries.
The Historical Volatility (HV) is at 6.71, which is considered moderate. This level of historical volatility suggests that recent price movements are balanced, neither too volatile nor too stable. It indicates a market that is experiencing a reasonable amount of fluctuation, which traders might find conducive to making informed decisions without being overwhelmed by extreme volatility.
The Choppiness Index (CHOP) stands at 29.11. A CHOP value below 50 typically indicates a trending market. Thus, the relatively low value of 29.11 suggests that the market is currently in a trending phase rather than being choppy. This is important for traders who prefer to follow trends rather than deal with erratic price movements.
Lastly, the Rate of Change (ROC) is at -1.14. A negative ROC indicates that the price is decreasing compared to the previous period. However, since the value is close to zero, it suggests minimal momentum. This means that while there is a slight downward trend, the strength of this movement is weak, indicating that the market is not experiencing strong directional pressure.
In summary, the 30-minute BTC/USDT chart reflects a market with moderate volatility and a slight upward trend towards the end. The high VIX signals expectations of significant price movements, while the Keltner Channels, Historical Volatility, Choppiness Index, and Rate of Change all combine to paint a picture of a market that is trending, albeit with moderate volatility and minimal momentum. This analysis provides a nuanced understanding of the current market dynamics, guiding traders in their decision-making processes.
Chart Analysis (Second Chart: 6-hour interval)
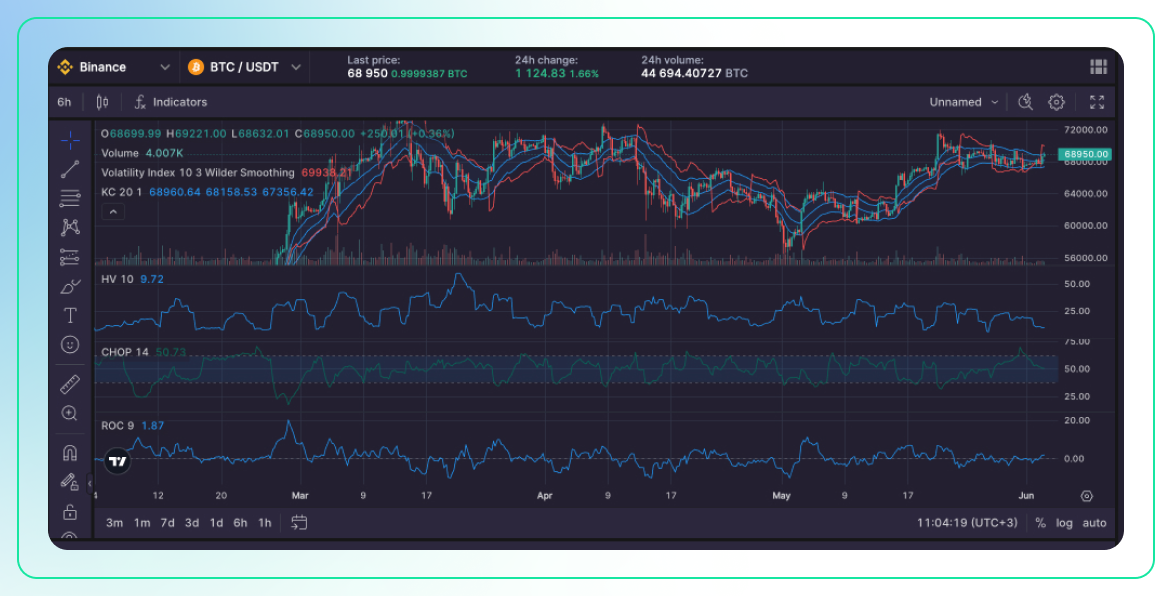
Examining the 6-hour interval chart for BTC/USDT reveals a price range between approximately 64,000 and 70,000. The chart depicts several ups and downs, indicative of a fluctuating market over this longer period. This pattern of price movement suggests that the market is experiencing varied phases of upward and downward trends, reflecting the broader market sentiment over time.
The volume in this chart is notably higher compared to the 30-minute interval chart. There are occasional spikes in volume, which indicate periods of heightened trading activity. These spikes are often associated with significant market events or news that drive traders to buy or sell in large quantities.
The Volatility Index (VIX) stands at 69,933.6, which remains high. Similar to the shorter interval chart, this high VIX value indicates that the market expects high volatility over the next 30 days. Traders and investors anticipate significant price movements, which could be driven by upcoming events or broader market developments.
Analyzing the Keltner Channels, the price oscillates within these bands, frequently touching the upper and lower limits. This behavior suggests periods where the market experiences overbought and oversold conditions. When the price hits the upper band, it could indicate that the asset is overbought, while touching the lower band suggests oversold conditions. The repeated touching of these bands indicates a moderately volatile market where prices are frequently adjusting to new highs and lows within a defined range.
The Historical Volatility (HV) is recorded at 9.72, which is slightly higher than in the 30-minute chart. This increase suggests that the market has experienced more volatility over this longer period. It indicates that price movements have been more pronounced, contributing to a higher degree of market fluctuation.
The Choppiness Index (CHOP) is around 50.73, indicating a market that is neither strongly trending nor completely directionless. This value suggests a choppy market with no clear trend, reflecting a phase where the price fluctuates without a strong directional movement. Such a market condition can be challenging for trend-following traders but may offer opportunities for those who thrive in sideways markets.
The Rate of Change (ROC) is at 1.87, indicating positive momentum. The positive ROC suggests upward momentum in price movement, although the value indicates only moderate strength. This means that while there is some upward pressure, it is not overwhelmingly strong, reflecting a more balanced or cautious market sentiment.
In summary, the 6-hour BTC/USDT chart shows a market with higher volatility compared to the 30-minute chart. The high VIX and increased Historical Volatility suggest significant price fluctuations are expected. The market trends are mixed, with periods of both upward and downward movements, evidenced by the choppy nature indicated by the Choppiness Index. The positive Rate of Change points to moderate upward momentum, but overall, the market lacks a strong directional trend over this longer period.
Conclusion
Volatility is a measure of the degree of variation in the price of a financial asset over time. It is an essential concept in trading, as it indicates the level of risk and potential reward. In the context of cryptocurrencies, volatility tends to be higher due to factors such as market infancy, speculative trading, regulatory news, and technological developments. This inherent volatility makes crypto markets both challenging and potentially lucrative for traders.
There are several key volatility indicators that traders use to navigate these turbulent waters. The Volatility Index (VIX), often known as the "fear gauge," measures market expectations of volatility over the next 30 days. The Keltner Channels (KC) help traders identify overbought and oversold conditions by analyzing price movements within a channel bounded by volatility-based bands. Historical Volatility (HV) quantifies past price movements to gauge how volatile an asset has been over a specific period, while the Choppiness Index (CHOP) indicates whether the market is trending or choppy. Rate of Change (ROC), although not a direct measure of volatility, provides insights into the momentum of price changes, which can be indicative of upcoming volatility.
Traders typically use these indicators to make informed decisions about entry and exit points, manage risk, and identify potential trading opportunities. For instance, a high VIX might suggest that traders brace for significant price swings, while touching the upper or lower bands of Keltner Channels might prompt buying or selling actions. Historical Volatility can help in setting appropriate stop-loss levels, and the Choppiness Index can guide traders on when to pursue trend-following strategies versus range-bound trading.
If you're interested in deepening your understanding of these and other technical indicators, we invite you to explore more articles on the Bitsgap blog, where we cover a wide range of topics related to technical analysis and trading strategies.
If you’re looking for a safe, reliable, and efficient place to analyze and trade crypto, consider using Bitsgap. The platform offers a broad range of smart trading tools, including advanced charting instruments, automated trading bots, smart orders, risk and portfolio management tools. Experience all these features with the first 7 days free. Start your trading journey with Bitsgap today and harness the power of volatility to your advantage.
