Top Momentum Indicators for Cryptocurrency Trading: ROC, OBV, ADX
Master reading the momentum indicator power trio — ROC, OBV & ADX — to predict explosive moves before they happen. We crack the code on how to use them to spot pivots and ride the ups and downs for winning trades.
With the cryptocurrency markets known for their rapid price changes and high volatility, technical analysis provides a critical toolset for traders aiming to make informed decisions.
The technical toolkit contains many indicators and oscillators serving different purposes – assessing trend direction/strength, spotting reversals, gauging momentum, and more. Skillfully applying these tools can greatly improve one's ability to profitably enter and exit trades.
This article explores three key momentum indicators: Rate of Change (ROC), On-Balance Volume (OBV), and Average Directional Index (ADX). Momentum indicators provide vital insights into the force behind market movements beyond just price changes. We will examine how each indicator functions, their distinct value adds, and using them together to enrich trading strategies.
What Is Momentum Trading & What Is Momentum Technical Analysis?
Momentum trading in cryptocurrencies is a strategy that involves buying and selling assets based on the recent strength of their price movements. Traders using this approach typically look for cryptocurrencies that are experiencing significant upward trends (positive momentum) or downward trends (negative momentum), and then trade these assets in the direction of their momentum. The core idea is that once a trend is established, it is likely to continue for a certain period rather than reverse immediately.
Momentum analysis, in turn, is a method used by traders to quantify the speed and change of price movements in cryptocurrencies. This analysis helps in identifying the strength of the asset's price trend over a specified period. Traders use various technical indicators to measure momentum, with some of the most common being: Relative Strength Index (RSI), Moving Average Convergence Divergence (MACD), and Stochastic Oscillator, each of which we’ve covered in separate articles on the blog.
Momentum Indicators vs Oscillators: What Are the Best Momentum Indicators and Oscillators?
Momentum indicators and oscillators are crucial tools used by traders to determine the strength and potential continuation of a price trend. Here are some of the best ones used in trading:
- Relative Strength Index (RSI): This oscillator measures the speed and change of price movements on a scale of 0 to 100. It helps identify overbought (typically above 70) or oversold (typically below 30) conditions.
- Moving Average Convergence Divergence (MACD): This trend-following momentum indicator shows the relationship between two moving averages of a price. The MACD is calculated by subtracting the 26-period Exponential Moving Average (EMA) from the 12-period EMA.
- Stochastic Oscillator: This momentum indicator compares a particular closing price of an asset to a range of its prices over a certain period. It uses a scale of 0 to 100 to identify overbought and oversold levels.
- Rate of Change (ROC): This indicator measures the percentage change in price between the current price and the price a certain number of periods ago. It provides a direct measure of momentum.
- On-Balance Volume (OBV): OBV uses volume flow to predict changes in stock price. Rising volume can indicate the continuation of a current trend, while declining volume might suggest an upcoming reversal.
- Average Directional Index (ADI): While primarily a trend strength indicator, ADI includes indicators that can also function as momentum indicators by measuring the strength of each upward or downward trend.
Difference between Momentum Indicators and Oscillators
While both momentum indicators and oscillators are used to measure the speed and strength of price movements, they differ mainly in how they are used to interpret market conditions:
- Momentum Indicators: These are typically bound to price movements and are used to identify the speed or strength of a price trend. They are not usually bound within a range. Momentum indicators are good for identifying trends and potential reversals based on the strength of movements. For instance, the Rate of Change (ROC) shows how rapidly prices are changing, which can indicate the strength of a trend.
- Oscillators: These are typically range-bound, usually between two extreme values like 0 and 100. They are best used to identify overbought and oversold conditions in a market. Oscillators oscillate around a center line or between a set of bounds and are particularly useful in sideways or ranging markets where there are no clear trends. For example, the Relative Strength Index (RSI) can indicate if an asset is due for a correction after an extreme movement in price.
👉 To put it briefly — while momentum indicators are generally used to assess the rate of price changes, pointing to the strength of trends, oscillators are more about identifying the cyclical behavior within markets, helping traders to pinpoint potential reversal points based on overbought or oversold conditions. Both are valuable in different market conditions and can sometimes overlap in their functionalities and uses.
Since we’ve extensively covered RSI, MACD, and Stochastic in previous articles on the blog, this piece will review other top momentum indicators for cryptocurrencies that we have not covered before:
- Rate of Change (ROC)
- On-Balance Volume (OBV)
- Average Directional Index (ADI)
For information on other indicators, feel free to browse the blog.
Rate of Change (ROC)
The Rate of Change (ROC) indicator measures the percentage rate at which a cryptocurrency's price has changed over a specified period. The ROC indicator is graphed with zero as its midpoint. If price changes are positive, the indicator rises above zero into positive territory, and if price changes are negative, it falls below zero into negative territory. This indicator is useful for identifying divergences, detecting overbought and oversold conditions, and observing crossovers of the centerline. It is calculated as follows:
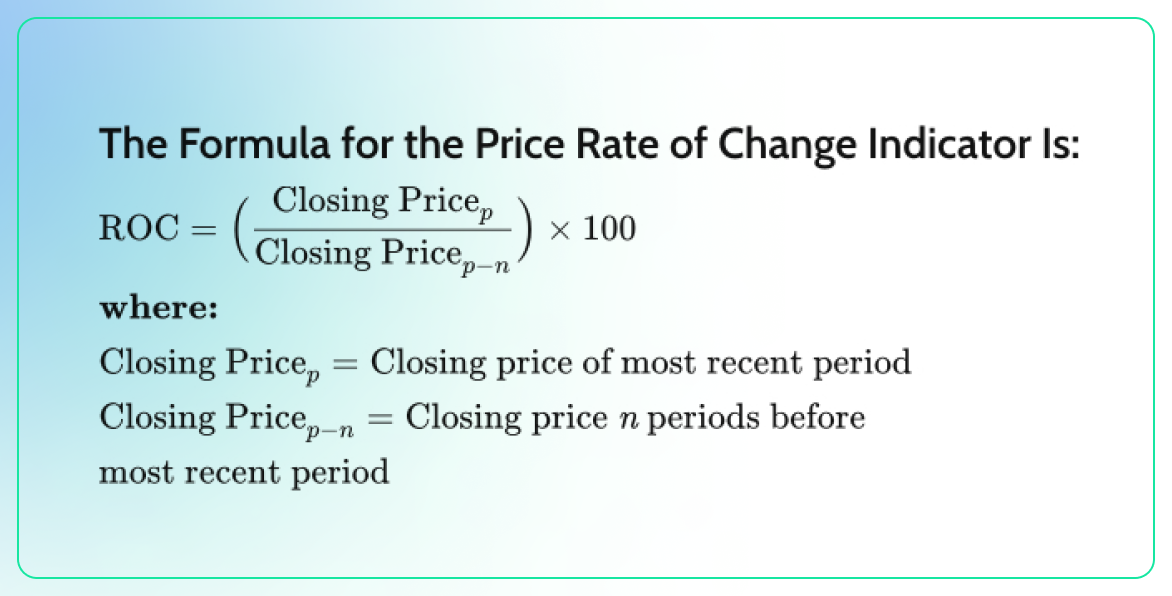
The primary task in computing the ROC is selecting the "n" value, which represents the number of periods ago to compare the current price. Short-term traders might opt for a smaller "n" value, like 12, allowing the ROC to respond swiftly to price changes, though this may lead to more false signals. In contrast, longer-term investors might choose a larger "n" value, such as 200, resulting in a slower response from the ROC but potentially providing more reliable signals when they do appear.
What Does ROC Say?
The Price Rate of Change (ROC) is categorized as a momentum or velocity indicator, as it quantifies the strength of price momentum through its rate of change. For instance, consider a scenario where a coin’s closing price today is $15, and it was $10 ten trading days ago. The ten-day ROC would be 50%, calculated as: ((15−10)÷10)×100=50
Typically, the ROC is displayed in a separate window beneath the main price chart. It is graphed against a zero line, which separates positive values from negative ones. Positive ROC values suggest upward momentum or buying pressure, whereas negative values suggest downward momentum or selling pressure. An increase in either positive or negative values signifies growing momentum, while a return towards zero suggests that momentum is decreasing.
Zero-line crossovers might signal shifts in trend direction. The timing of these signals can vary depending on the 'n' value chosen: a smaller 'n' value might indicate a trend change earlier, whereas a larger 'n' value might detect it later. However, due to frequent whipsaws near the zero line, these signals are typically not used directly for trading but rather as alerts to potential trend changes.
Additionally, traders use overbought and oversold levels, which are not fixed and can vary depending on the asset. Traders observe the ROC values that previously led to price reversals. Identifying common positive and negative ROC values where reversals occurred can alert traders to potential price changes when these extremes are reached again. If the ROC reaches these levels and the price begins to reverse, confirming the ROC's signal, a trade might be considered viable.
The ROC also serves as a divergence indicator, highlighting potential forthcoming trend changes. Divergence occurs when the asset's price moves in one direction and the ROC moves in the opposite. For example, if a stock's price is climbing while the ROC is declining, this suggests bearish divergence, indicating a potential downward trend change. Conversely, if the price is falling and the ROC is rising, this could suggest a bullish divergence, signaling a potential upward price movement. It's important to note that divergences can be misleading as timing signals since they can persist for extended periods without necessarily leading to a price reversal.
Technical Analysis Cheatsheet with ROC:
- Trend Identification: A positive ROC value suggests an uptrend, while a negative ROC indicates a downtrend.
- Overbought/Oversold Levels: Extreme ROC values can signal overbought (potential sell) or oversold (potential buy) conditions.
- Divergence: When the price forms new highs or lows that are not supported by the ROC, it suggests a weakening trend and potential reversal.
Example Technical Analysis with ROC Momentum Indicator
Now, let’s look at the following 12-hour BTC/USDT chart and examine it with the ROC indicator:
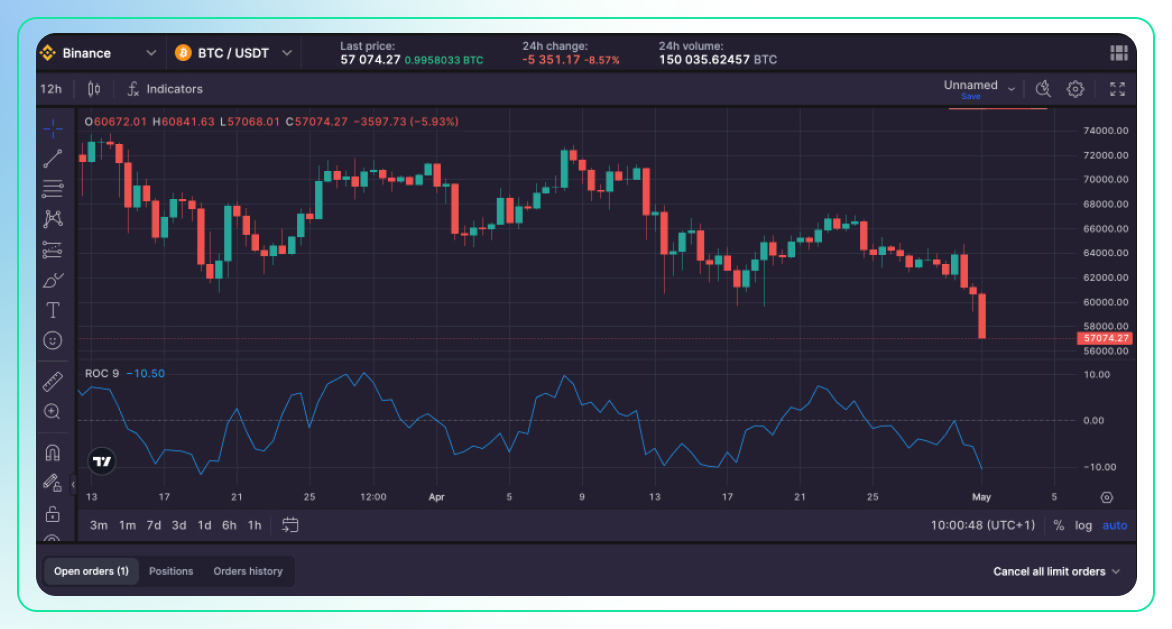
The Rate of Change (ROC) indicator depicted in the chart is currently showing a value of -10.50, which signals a strong bearish momentum for the Bitcoin (BTC) market against Tether (USDT). The ROC indicator measures the percentage change in price from one period to the next, and a negative value indicates that the price is decreasing over time.
As we can see from the chart, the ROC has been fluctuating above and below the zero line, which separates positive and negative momentum. However, the most recent move has been a sharp decline below the zero line, suggesting a rapid decrease in price.
This bearish signal is further confirmed by the large red candlesticks on the price chart, indicating significant selling pressure. Traders might consider this an opportunity to enter short positions or exit long positions, anticipating further downward movement in price.
👉 It's important to note that while the ROC can provide valuable insights into market momentum, it should not be used in isolation.
On-Balance Volume (OBV)
On-Balance Volume (OBV) is a cumulative indicator that uses volume flow to predict changes in stock price. Volume on up days is added to the OBV total, and volume on down days is subtracted:
- If today's closing price is higher than yesterday's, add today's volume to yesterday's OBV.
- If today's closing price is lower than yesterday's, subtract today's volume from yesterday's OBV.
- If today's closing price equals yesterday's price, the OBV does not change.
What Does OBV Say?
In the cryptocurrency market, the On-Balance Volume (OBV) indicator is used to assess the buying and selling pressures of a specific cryptocurrency. Essentially, it tracks the trading volume of a cryptocurrency on an exchange and analyzes how this volume correlates with the price movements of the cryptocurrency over a certain timeframe. When both the trading volume and the price of a cryptocurrency are increasing, it is considered a bullish signal, suggesting strong buying pressure and a likely continuation of the upward trend. On the other hand, if both the trading volume and the price are decreasing, it signals bearish conditions, indicating weak selling pressure and a potential reversal of the downward trend.
By examining both volume and price data together, traders are better equipped to understand the direction and momentum of a trend, allowing them to tailor their trading strategies more effectively. A major advantage of the OBV indicator is its role in confirming price trends. If the OBV indicator increases alongside a rising price, it reinforces the validity of the bullish trend. Similarly, a falling OBV indicator coupled with a declining price confirms a bearish trend.
Technical Analysis Cheatsheet with OBV:
- Trend Confirmation: An increasing OBV along with increasing prices confirms an uptrend; decreasing OBV with decreasing prices confirms a downtrend.
- Divergence: If the OBV is moving in the opposite direction of the price, it suggests a potential price reversal. For example, if the price is rising but OBV is declining, the upward price movement may not be sustainable.
Example Technical Analysis with OBV Momentum Indicator
Now, let’s look at the following daily DOT/USDC chart and examine it with the OBV indicator:
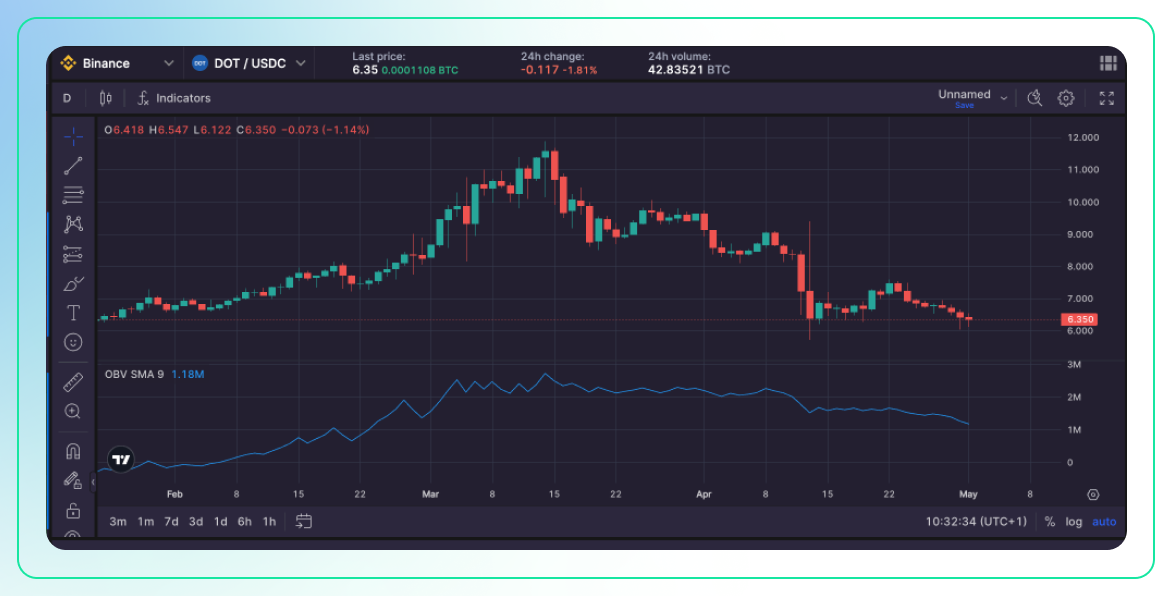
Based on the OBV (On-Balance Volume) indicator, it appears that there is a divergence between the price action and the volume trend. The OBV line shows a gradual decline from the beginning of April, which suggests that the selling pressure is increasing. This is confirmed by the downtrend in the price, which started to decline at the same time.
The fact that the OBV line is steadily declining while the price is also falling indicates that the downward momentum is strong and that the sell-off is supported by increasing volume. This could mean that the bearish sentiment is strong, and the price may continue to decline in the near term.
Overall, the technical analysis based on the OBV indicator suggests that the market for DOT/USDC is in a bearish phase, with increasing selling pressure that could lead to further declines in price. Traders may want to exercise caution and consider taking short positions or waiting for a potential reversal before entering new long positions.
👉As a friendly reminder — never use OBV alone, just like any other indicator. Use a combination for optimal results.
Average Directional Index (ADX)
The Average Directional Index (ADX) is part of the Directional Movement System developed by Welles Wilder and includes two other indicators: the Positive Directional Indicator (+DI) and the Negative Directional Indicator (-DI). ADX measures the strength of a trend but does not indicate its direction. It is calculated from a smoothed average of the differences between +DI and -DI and ranges from 0 to 100. The ADX involves a series of computations because it consists of multiple lines within the indicator:
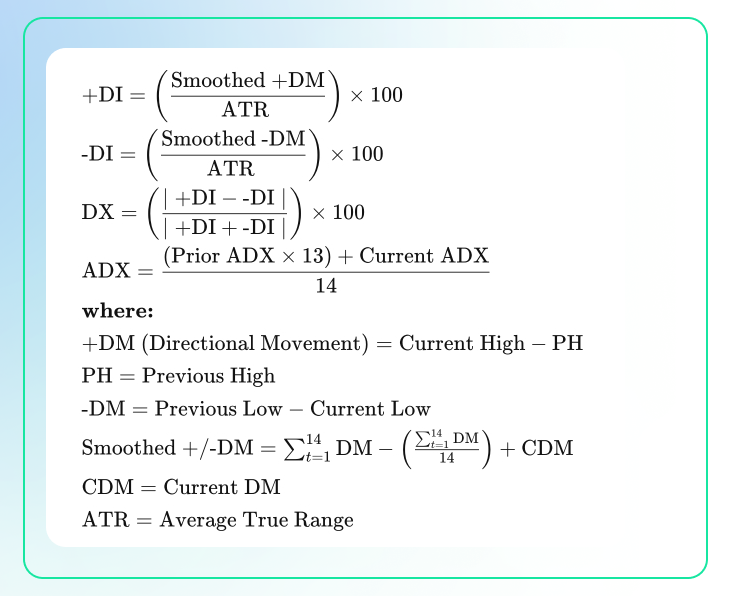
What Does ADX Say?
The ADX measures the strength of a trend, while the -DI and +DI indicate the trend's direction.
A strong trend is indicated by an ADX value above 25, whereas a value below 20 suggests a weak trend. The crossing of the -DI and +DI lines provides trading signals. For instance, a buy signal is suggested when the +DI line crosses above the -DI line, particularly if the ADX is above 20, and ideally above 25. Conversely, a crossover of the -DI above the +DI, coupled with an ADX above 20 or 25, signals a potential opportunity for a short sale.
These crossovers are also useful for deciding when to exit trades. For example, if holding a long position, consider exiting if the -DI crosses above the +DI. Additionally, when the ADX falls below 20, it indicates a lack of a clear trend, suggesting that it might not be the best time to initiate a trade.
Technical Analysis Cheatsheet with ADX:
- Trend Strength: An ADX value above 25 indicates a strong trend, making it a good environment for trend-following strategies. Values below 25 suggest a weak trend or a range-bound market.
- Directional Indicators:
- +DI and -DI Crossings: A crossing of +DI above -DI suggests a potential buy signal as it indicates that the uptrend is gaining strength. Conversely, -DI crossing above +DI indicates a strengthening downtrend, suggesting a sell signal.
- Trend Direction: Monitor the relationship between +DI and -DI to assess trend direction and strength.
Example Technical Analysis with ADX Momentum Indicator
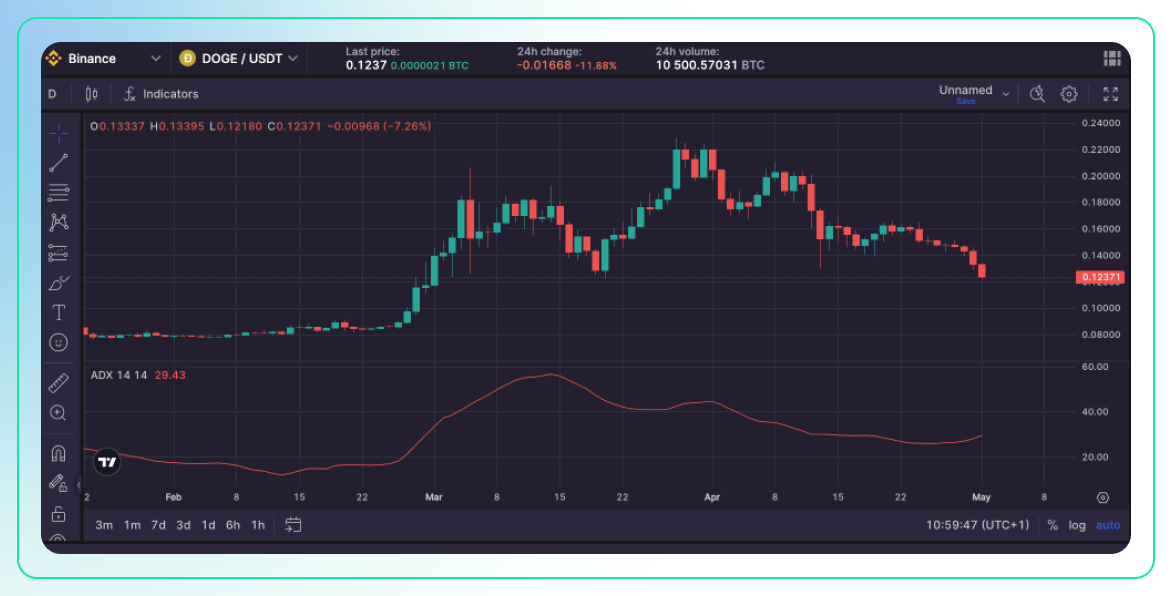
Based on the ADX indicator on the chart provided, we can see that the ADX line (red line) at the bottom of the chart is currently at a level of 29.43. This value indicates that there is a moderate trend strength present in the market.
The ADX line is below the threshold of 25, which typically suggests that the trend strength is not very strong. However, it is still above the 20 level, which implies that there is still some directional movement present in the price action.
Looking at the price chart, we can see that the market has been in a downtrend as the price has been making lower highs and lower lows since the peak on April 18th. The recent bars are red, indicating bearish price action, and the price is currently trending downwards.
The fact that the ADX value is below 25 and the price is in a downtrend suggests that traders should be cautious about entering long positions at this time. It may be wise to wait for the ADX to rise above 25 and for a trend reversal signal before considering a bullish trade.
Overall, the technical analysis based on the ADX indicator suggests that the current trend is moderately bearish and traders should watch for a potential continuation of the downtrend or look for signs of a trend reversal before making any trading decisions.
Bitsgap as an Ultimate Technical Analysis & Trading Tool
Conducting thorough investment research is critical for consistent trading profits, yet most traders rely on the potentially biased or incorrect free research of others. While some free resources have value, sustaining success requires rolling up your sleeves and doing your own in-depth analysis.
Fortunately, there are quality tools to aid research. Fundamental analysis can be done through news sites and company information. Technical analysis is supported by platforms like TradingView and Bitsgap.
Bitsgap, specifically, connects traders to over 15 exchanges, with built-in charting, indicators like those discussed here, trading bots, and more. Doing the hard research work, paired with leveraging a platform like Bitsgap, empowers traders to gain a competitive edge and profitability. The key is not taking shortcuts, but combining personal analysis with enabling technologies
As mentioned, Bitsgap has everything at your fingertips — advanced TradingView charts, drawing tools, a wide selection of indicators and oscillators, a proprietary "Technicals" widget that condenses signals from multiple indicators, trading bots, performance tracking, and more. With everything conveniently accessible on one platform, Bitsgap aims to simplify technical analysis while saving time. The first 7 days are free, so why not sign up now?
Conclusions
Momentum indicators are crucial tools for cryptocurrency traders, helping to gauge the strength and direction of market trends. These tools, which include both momentum indicators and oscillators, provide insights not just into the velocity of price movements but also into potential reversals and continuations of trends.
Among the top momentum indicators for cryptocurrency trading are the Rate of Change (ROC), On-Balance Volume (OBV), and Average Directional Index (ADX). Each of these serves a specific function:
- ROC measures the percentage change in price over a specific period, helping traders identify the speed of price movements. A rising ROC generally indicates strengthening upward momentum, and vice versa for a declining ROC, suggesting potential entry or exit points based on the acceleration or deceleration of price trends.
- OBV is used to track the volume flow, providing insights into the strength behind price movements. An increasing OBV alongside an increasing price confirms a bullish trend, whereas a decreasing OBV with a falling price confirms bearish tendencies. This indicator helps confirm the legitimacy of a trend based on volume activity.
- ADX helps determine the strength of a trend. A high ADX value (typically above 25) signifies a strong trend, either up or down, while a low ADX (below 20) suggests a weaker or non-trending market. The accompanying directional indicators, +DI and -DI, further aid in identifying the trend direction, offering cues for potential buying or selling opportunities.
When used in combination, ROC, OBV, and ADX offer a robust framework for making informed trading decisions in the cryptocurrency market. For instance, a trader might look for scenarios where the ROC indicates increasing momentum, the OBV confirms buying pressure, and the ADX shows a strong trending environment. This confluence can significantly enhance the probability of successful trades by aligning volume, price momentum, and trend strength, thereby providing a comprehensive picture of the market dynamics.
Thus, by effectively integrating these indicators into their trading strategies, cryptocurrency traders can not only optimize their entry and exit points but also enhance their overall trading performance, leveraging the unique strengths of each indicator to navigate the volatile crypto markets.
