The MACD Method: How to Use MACD in Crypto
Explore how the MACD's ingenious fusion of moving averages can sharpen your decision-making in this must-read piece.
As countless crypto enthusiasts have discovered, the MACD indicator is an indispensable tool for spotting crucial price moves. Learn how you can leverage MACD too.
With price swings that would make most "normies" nauseous, crypto trading can feel like an intense rollercoaster for your money. To prevent your portfolio from taking a tumble, follow the example of numerous traders who rely on the Moving Average Convergence Divergence (MACD) indicator, fondly referred to as the trusty crypto sidekick that aids in identifying crucial price movements before a significant drop (or skyrocket!).
The MACD indicator offers a plethora of valuable insights when examining price shifts. To assist you in navigating the complex twists and turns of the crypto markets, we will explain how the MACD can support you in making well-informed choices. Fasten your seatbelt as we unravel the mysteries of using the MACD's prowess for your cryptocurrency trading journey.
MACD Indicator Explained
The Moving Average Convergence Divergence, or MACD, is a widespread oscillator-style trend-spotting tool du jour for savvy traders looking to ride the waves of the market. Developed in the groovy 1970s by Gerald Appel, MACD leverages moving averages to gauge the momentum of various tradable assets, such as stocks and cryptocurrencies.
While the MACD may be "lagging" since it surfs on historical data, many traders still use it to catch waves they might have otherwise missed, pinpoint optimal entry and exit positions, and avoid wipeouts. To grok the MACD, you first need to understand the moving averages. Moving averages are just lines showing the average value of prices over a certain amount of time. They come in two main flavors: simple moving averages (SMAs), which give equal weight to all prices, and exponential moving averages (EMAs) which place greater emphasis on more recent data points.
Although you can tailor indicators to match your preferred gnarly trading style, the default MACD settings involve a 26-period EMA and a 12-period EMA.
👉 Fast forward to the meat of the issue: When the short-term EMA crosses above the long-term EMA, it's time to paddle out and catch that uptrend wave! Crossing below signals it's time to bail unless you want to end up in a trading "wipeout."
How MACD Indicator Works
The MACD is a totally versatile technical tool for savvy traders looking to catch opportunities and keep their positions dialed in as the market moves. Just like its old-school moving average cousins, the MACD offers traders an inside peek into how the market is acting and how prices are moving and shaking.
Now, let’s get more technical.
Under the hood, the MACD comprises four elements (Pic. 1):
- The MACD line
- Signal line
- Zero line
- Histogram
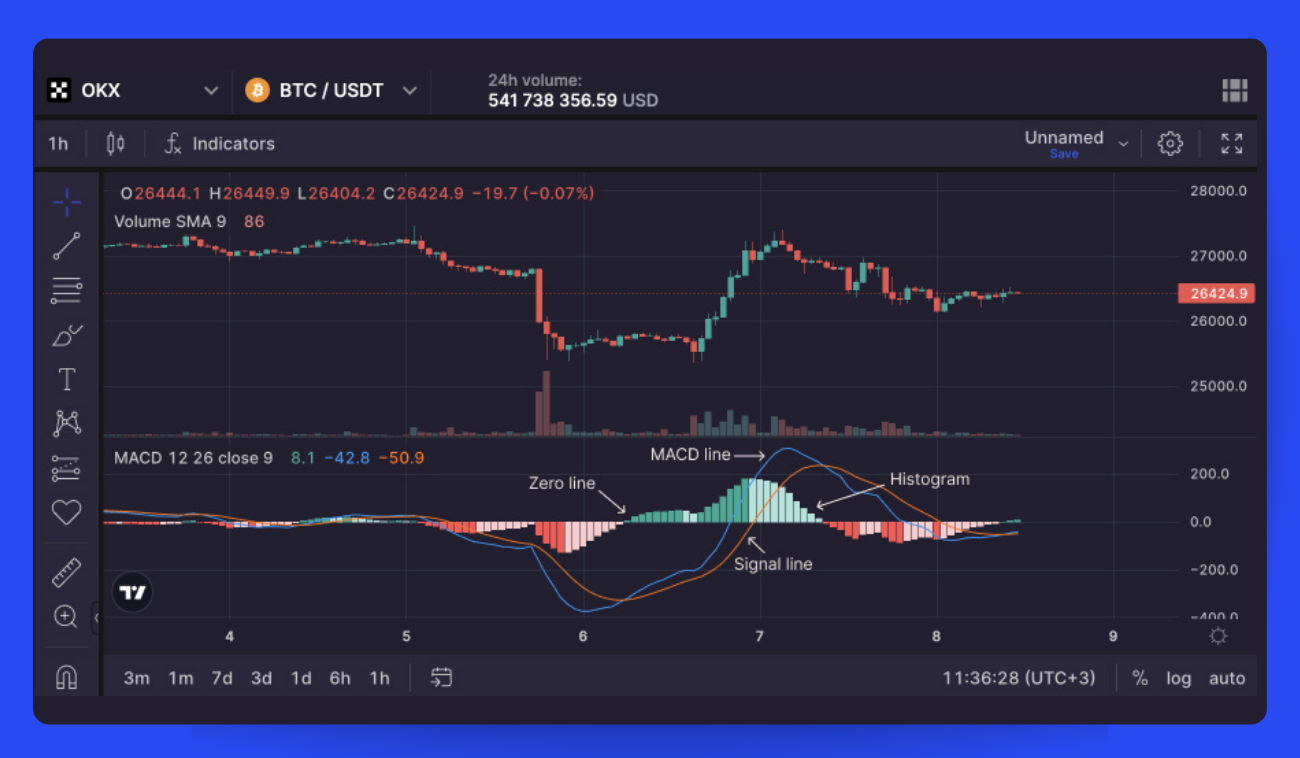
Essentially, the MACD indicator is depicted as two separate lines: the MACD line and the signal line. The MACD line is determined by taking the difference between the 26-period EMA and 12-period EMA, while the signal line is a fixed 9-period EMA.
👉 EMAs are favored over regular moving averages to enhance responsiveness to price momentum and alterations in trends.
Additionally, a histogram is employed to measure the gap between the MACD line and the signal line. It will be positive when the MACD line surpasses the signal line, or negative when the signal line is above the MACD. As the price movement progresses, this gap expands and contracts, signifying fluctuating market conditions. Though not infallible, this data assists in pinpointing trends, rotating markets, and impending reversals.
The zero line simply represents the point at which the MACD line equals zero. It indicates the level at which the 26-period EMA and 12-period EMA are identical.
In contrast to other oscillating indicators, such as the Relative Strength Index (RSI), the MACD lacks a fixed range. Consequently, it is unsuitable for evaluating overbought and oversold conditions like oscillators possessing maximum and minimum values.
How and What Does the MACD Indicator Measure?
As previously discussed, the MACD’s main parts bounce around the zero line:
- The MACD line: Helps spot upward or downward momentum (trends) in the market. It's calculated by subtracting two exponential moving averages (EMAs).
- The signal line: An EMA of the MACD line (typically a 9-period EMA). Checking out the signal line and MACD line together can help detect when the wave may be about to change direction or when it's time to paddle out or head to shore.
- Histogram: A visual of how the MACD line and signal line are diverging or converging. It's calculated by subtracting the two lines.
The MACD line
Generally, exponential moving averages are computed using an asset's closing prices, with the periods for calculating the two EMAs typically set at 12 periods (faster) and 26 periods (slower). Though MACD can be customized for different trading styles and periods can be set to minutes, hours, days, weeks, and months, we'll focus on daily settings here.
With standard time ranges, the MACD line is calculated by subtracting the 26-day EMA from the 12-day EMA.
MACD line = 12d EMA - 26d EMA
As we said before, the MACD line crossing above or below the zero line shows the 12-day and 26-day EMAs changing position relative to each other.
The signal line
By default, the signal line is derived from the 9-day EMA of the primary line, offering additional insights into its past movements.
Signal line = 9d EMA of MACD line
While not perfect, MACD line and signal line crossings usually mean the trend is reversing, especially when they happen far above or below the zero line.
The MACD histogram
Serving as a visual representation of the relative movements of the MACD line and signal line, the histogram is simply calculated by subtracting one from the other:
MACD histogram = MACD line - signal line
Instead of a third moving line, the histogram uses a bar chart, making it easier to see and understand.
👉 Note that the histogram bars are not related to the asset's trading volume.
Understanding MACD in Crypto: How to Read MACD
The Moving Average Convergence Divergence (MACD) indicator, as the name implies, monitors the relationship between moving averages, which can be characterized as either converging or diverging. Convergence occurs when the lines move towards each other, while divergence takes place when they separate.
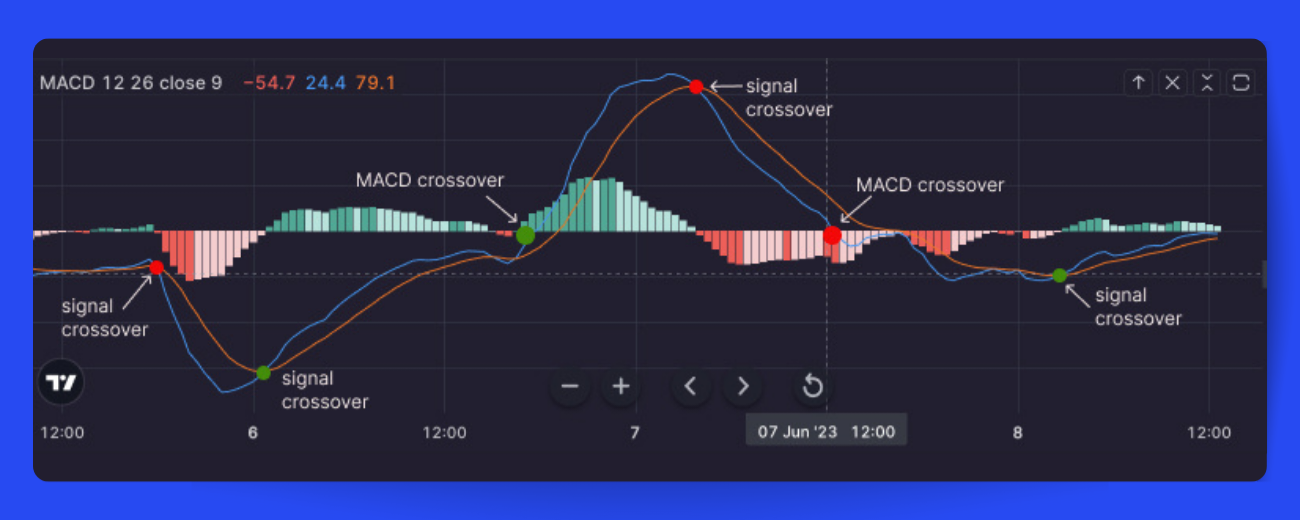
The key signals to watch for are (Pic. 2):
- Centerline crossovers: When the MACD line crosses above or below the centerline (zero line). Above the line means the short-term average is higher than the long-term average, indicating upside momentum and potential for price increases. Below the line means the opposite. Crossing the centerline can signal the trend is changing direction.
- Signal line crossovers: When the MACD line crosses above or below the signal line. Crossing above is a buy signal as it shows upside momentum is building. Crossing below is a sell signal. However, signal line crossovers often give false signals, especially for volatile assets. It's best not to rely on them alone.
In addition to centerline and signal line crossovers, MACD charts can also offer insight through divergences (Pic. 3) between the MACD and the asset's price action.
For example, if a crypto's price makes a higher high but the MACD makes a lower high, that's a bearish divergence. Even though the price went up, the momentum behind it (buying pressure) isn't as strong. Bearish divergences usually mean a selloff is coming because they tend to happen right before reversals.
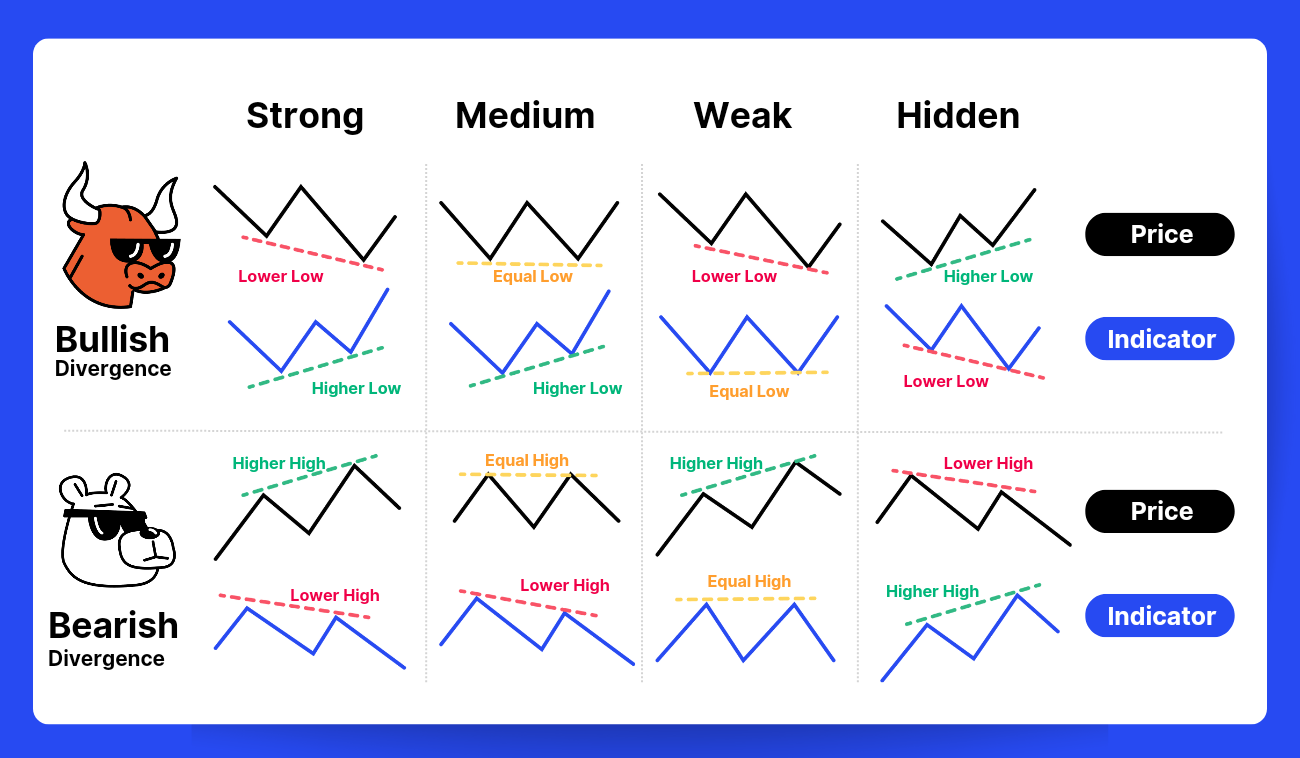
On the flip side, if the MACD line makes two higher lows while the asset's price makes two lower lows, that's a bullish divergence. Although the price dropped, buying pressure is actually stronger. Bullish divergences typically lead to price reversals, signaling a short-term bottom may be forming (downtrend changes to uptrend).
MACD Bullish/Bearish Divergence
A MACD bullish (or positive) divergence (Pic. 3) refers to a situation where the MACD does not achieve a new low, even though the asset's price has reached a new low. This is perceived as a favorable trading signal, hence the term "bullish/positive divergence."
Conversely, if the asset's price reaches a new high but the MACD fails to do so, this is considered a bearish signal and is called a "bearish/negative divergence."
In both instances, the configurations indicate that the upward or downward movement may not be sustainable, so it is crucial to examine additional technical analyses, such as the relative strength index (RSI).
Crypto MACD strategy: How to Use MACD in Crypto Trading
MACD is commonly employed as a part of trend-following strategies, which can be applied to various timeframes, such as intraday, daily, or multiple-day trading styles.
In truth, your success in using MACD to trade cryptocurrencies depends on how effectively you interpret the interaction between the indicator's two lines.
Here are the basic interpretations of MACD:
- Buy: When the MACD line crosses above the signal line, it may be a good time to buy.
- Sell: When the MACD line crosses below the signal line, it may be a good time to sell.
- Wait: If the MACD line and signal line are close together, or if there are frequent crossovers, it's better to wait for more evidence before making a move.
For more precise interpretations, try adhering to the following key concepts:
- Trend Following: Primarily, the MACD functions as a trend trading indicator, making it most effective when detecting new trends and joining existing ones. Utilizing MACD in multiple time frames can help you understand how smaller price movements fit into the larger market direction. This allows for fine-tuning market entry within an existing trend or entering a developing trend early. While riskier, the MACD can also be used to trade market reversals, potentially providing valuable entry and exit points.
- False Signals: One major drawback of the MACD is its tendency to generate false signals that can mislead traders and result in losing trades. During periods of minimal price movement or consolidation, the MACD line and signal line cross more frequently, leading to numerous false signals. To avoid this issue, ensure you target an active cryptocurrency market when using the MACD.
- Risk Management: Employing proper risk management principles is crucial when using the MACD or any trading strategy. Effective risk management not only safeguards your capital but also allows you to trade for an extended period. Limiting leverage, reducing stops, and avoiding overtrading are three ways to protect yourself from bad luck.
👉 Predicting price movements in cryptocurrency markets can be as challenging as in forex, stocks, or futures. The MACD indicator can help with this task by providing general directional guidance. When the MACD line crosses above the signal line, the price is likely to rise, and when it crosses below, the price may fall. As the distance between the lines increases, the market is trending; as it decreases, a reversal becomes more probable.
When using the MACD, be aware of these common issues and address them when trading in live cryptocurrency markets:
- Not Considering Market State: Recognize whether a market is trending or moving sideways. The MACD is less effective in sideways markets.
- Excessive Leverage: Even if the MACD suggests a buy or sell signal, don't over-leverage your position. Always use appropriate position sizing and leverage.
- Inconsistency: Remove the "human element" when trading with the MACD. Many traders use the indicator inconsistently, so integrate it into a comprehensive trading plan.
MACD vs RSI
The relative strength index (RSI) is designed to identify whether a market is overbought or oversold in relation to recent price levels. The RSI is an oscillator that calculates average price gains and losses over a specified time frame. By default, it uses 14 periods and ranges from 0 to 100. A reading above 70 indicates an overbought condition, while a reading below 30 signifies an oversold state, both of which could potentially signal the formation of a top or a bottom.
In contrast, the MACD lines do not have specific overbought or oversold levels. Instead, they operate on a relative basis. This means that an investor or trader should concentrate on the level and direction of the MACD/signal lines in comparison to previous price movements of analyzed crypto.
Though both MACD and RSI measure momentum, they analyze different factors and can give conflicting signals. For example, the RSI may stay above 70, signaling overbought, while the MACD shows increasing momentum. Either indicator may signal an impending trend change by diverging from the price (the indicator weakens while the price continues rising, or vice versa). Still, analysts often use both indicators together to get a more complete view of the market (along with other indicators, of course, to confirm or refute the analysis).
Why MACD May Not Work for Cryptocurrency
One of the biggest problems with divergence is that it often cries wolf — signaling a reversal that never comes. It also misses some real reversals. Divergence tends to spot slowdowns after a price shoots up or down, assuming a reversal is nigh. But prices frequently slow for a bit without truly reversing.
After a wild price swing, the pace usually slackens, even if the trend holds. Crypto markets in particular bounce and blast at breakneck speeds, leaving old-school tools like the MACD dazed and confused.
"False positive" divergence usually shows up when prices stall out, treading water in a range or triangle. As the price meanders sideways, the MACD retreats from its highs or lows, edging toward the midpoint.
The MACD converges in these sideways periods because the gap narrows between its fast and slow moving averages — the very gap it's designed to track. The averages struggle to drift apart without a trend to follow. So the MACD's signals fade and fuzz, since moving averages work best when prices actually, you know, move.
In these choppy waters, the MACD nearly always floats back to the middle, a far cry from its recent highs or lows. Divergence surfaces as a matter of course. But these signs are mostly meaningless, as the MACD bobs along with the oscillations, clueless as to where the price may roam next.
However, there’s a solution — use MACD along with other indicators, compare and contrast, that sort of thing.
👉 By the way, did you know that Bitsgap has a super cool Technicals widget that mashes up signals from a toolbox of indicators and oscillators and condenses the mess into a simple snapshot so you don’t have to?
Well, at Bitsgap, we know that traders often juggle a variety of indicators to make trading calls. That’s why we’ve come up with something waaaay simpler — the Technicals widget — that streamlines this circus act, blending and averaging the most popular indicators into one gauge.
Technicals serves up real-time technical analysis for any timeframe you choose. Flip between timeframes to compare and stick with your favorite.
The results boil down to Buy, Neutral or Sell signals for each indicator. Easy peasy, right?
That said, you’ll still have to do the hard work — the technicals. But don’t fret — Bitsgap helps here too. Meet the built-in TradingView interface that adds its fair share of pizzazz to otherwise taxing tech homework. Visually stunning charts and handy drawing tools are all at your disposal, so use them to your heart’s content.
Bottom Line: MACD Power
And the verdict is — the MACD is a simple yet powerful indicator that combines the best of both worlds — market momentum and trend analysis — all in one sleek package. Just remember, variety is the spice of life - so mix up your signals and don't let MACD hog the entire spotlight.
FAQs
Is MACD Indicator Useful for Crypto Day Trading?
Sure, loads of traders put the MACD to work for crypto day trading. But the MACD alone won't cut it. No single signal should drive your trading strategy.
To really get a feel for where the market's headed, you need to tune into many frequencies at once. While the MACD can clue you in on whether to buy or sell for a day trade, if used well, it's still just one channel. To make the most of it, you'll want to flip between stations.
Can MACD Be Used for Scalping?
See, the problem with crypto is that it often turn on a dime, so tread cautiously. While scalping with the MACD may reap fat gains if you bet small, the market's moods can spin out unpredictably. So stake only what you can afford to lose in case a trade turns against you.
Can MACD Show When to Buy and Sell Crypto Assets?
No strategy is foolproof, but learning to work the MACD right can clue you into how your market moves. Then you can ride the trends you've mapped to bigger profits.
To avoid false signals, look for backup from other indicators. Wait for at least three signals to line up, backed by relevant news, rumors, or both. This multi-pronged approach lets you buy or sell with more guts.
Remember that the MACD works best when confirming the overall trend and market context. Check longer-term charts to see if the trend is your friend before following the MACD's lead. Look for signs that key levels are holding or breaking to gauge if a crossover may be for real. Scan newsfeeds to detect any developments that could fuel a trend change. When multiple indicators point the same way, the odds rise that a MACD signal is the real deal and not another false alarm.
Oh, and by the way, if looking for specific buy and sell signals from MACD, then peruse the article above, where we’ve broken them down like a crunchy choco chip.