Understanding Support and Resistance in Crypto
Join the ranks of crypto wizards, as we reveal the art of identifying, calculating, and capitalizing on support and resistance levels in the dynamic cryptocurrency landscape.
In the vibrant world of crypto technical analysis, the terms "support" and "resistance" frequently grace the lingo of market aficionados. Let's explore what support and resistance mean and unveil the insights they offer for skillful trading.
While the narrative around crypto trading is often negative, the truth is, as crypto gains mainstream adoption, technical analysis is proving to be the key to unlocking massive wealth in this market.
One of the most powerful tools in crypto technical analysis is identifying support and resistance levels. By spotting these crucial zones on a chart, traders can gain a huge edge in developing a winning trading strategy.
Want to discover the secrets of how crypto pros spot support and resistance, how they calculate and draw these pivotal levels, and how they turn them into profit? Read on to unearth the invaluable tips and tricks that can transform your crypto trading.
What Are Support and Resistance Levels in Cryptocurrency Trading?
Traders frequently rely on support and resistance levels as the market's chief yardsticks. These levels mark areas on a price chart where the market tide either rises or ebbs over time. While some traders peg support and resistance to fixed lines on a chart, others view them as broader zones where the market's currents run strong.
👉 You can think of support and resistance as the psychological tug-of-war between greed and fear in the market. Support is where greed gets the upper hand, as buyers overpower sellers, propelling prices. Resistance is where fear takes over, as sellers outnumber buyers, shoving prices back down again.
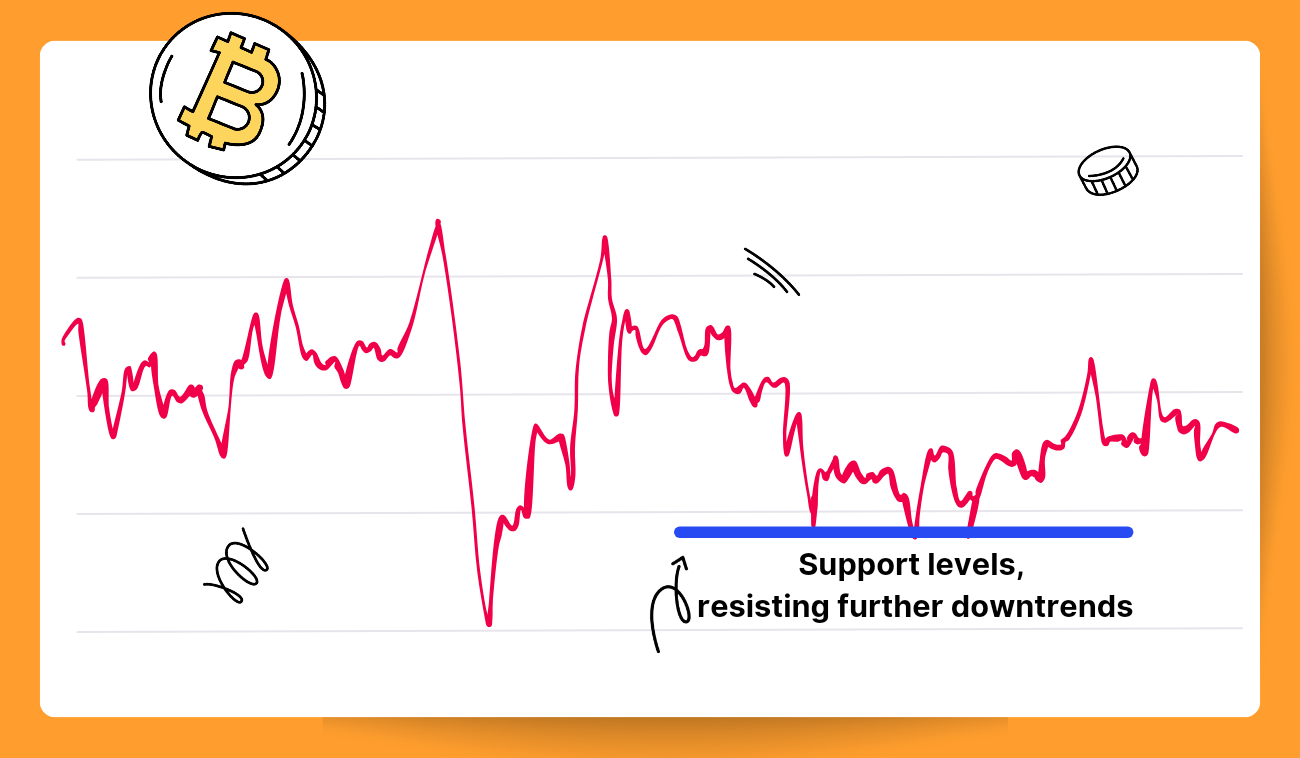
Support (Pic. 1) refers to a price floor where an asset is unlikely to fall through, as buying activity surges when prices hit this level. Buyers eagerly scoop up the asset while sellers hold back, boosting demand and hoisting prices.
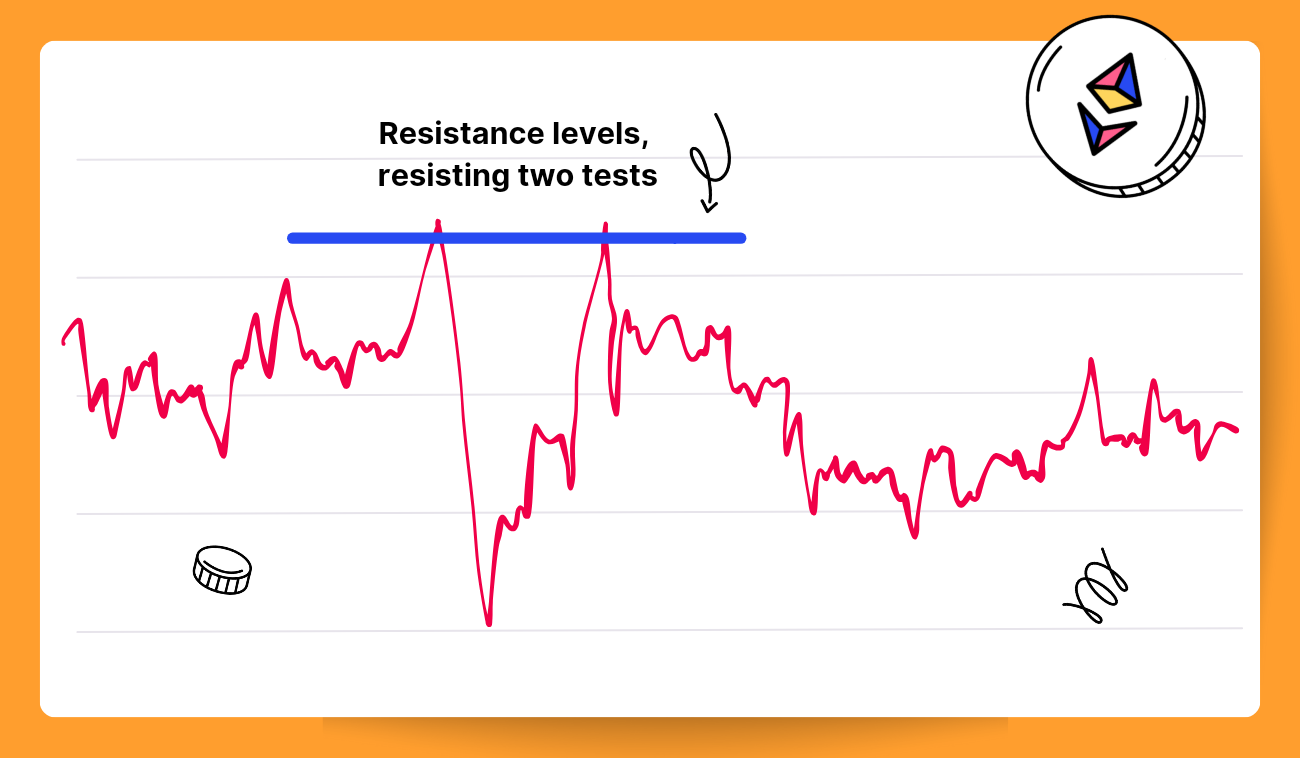
Resistance (Pic. 2) is a price ceiling that caps how high an asset's price can climb. At resistance, supply builds up and demand dwindles, ultimately causing the price to tumble.
When a trend bursts through either support or resistance, the market moves apace in that direction, forging new levels in its wake.
How to Find Support and Resistance in Crypto
There are five tried-and-true ways to spy support and resistance levels in any asset:
- Round numbers
Round numbers, like $20,000 or $10.50, hold a psychological sway over investors, who often trade around those figures, believing them significant. Say BTC leaps from $27,000 to $28,800. The next key resistance level may lurk around $29,500.
- Peaks and Troughs
Analyzing the highest highs (peaks) and lowest lows (troughs) over a period of time also helps in sporting coveted lines. Peaks signal the maximum price reached during market rallies. Troughs signal the lowest price hit during market declines. If an asset hits the same peaks and troughs repeatedly, these often become strong support and resistance levels.
- Moving Averages
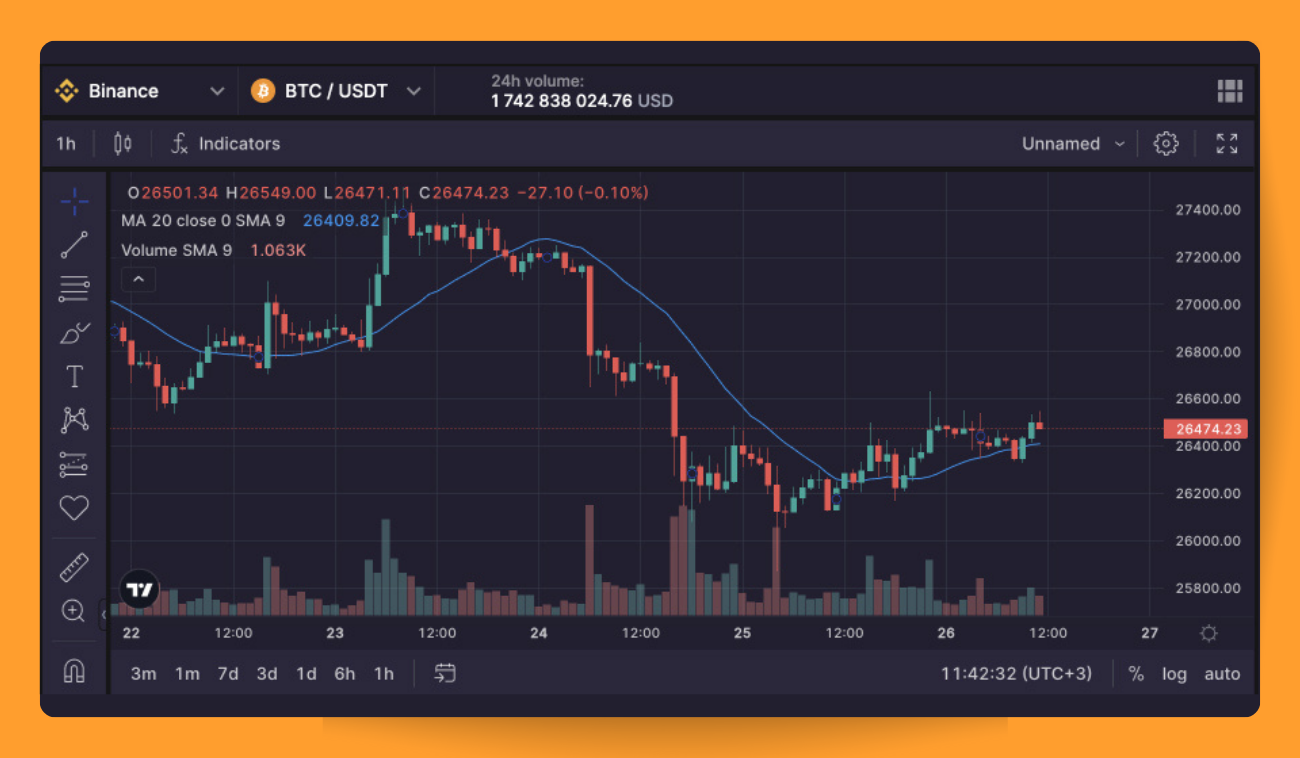
Moving averages (MAs) track an asset's average price over time (Pic. 3). The simple moving average (SMA) and exponential moving average (EMA) reign supreme in a typical trader’s toolkit, so use these to identify potential support and resistance levels. Look for areas where the asset price once bounced off a moving average. For instance, if a crypto's price often ricocheted off its 50-day simple moving average, that level may prove rock-solid support.
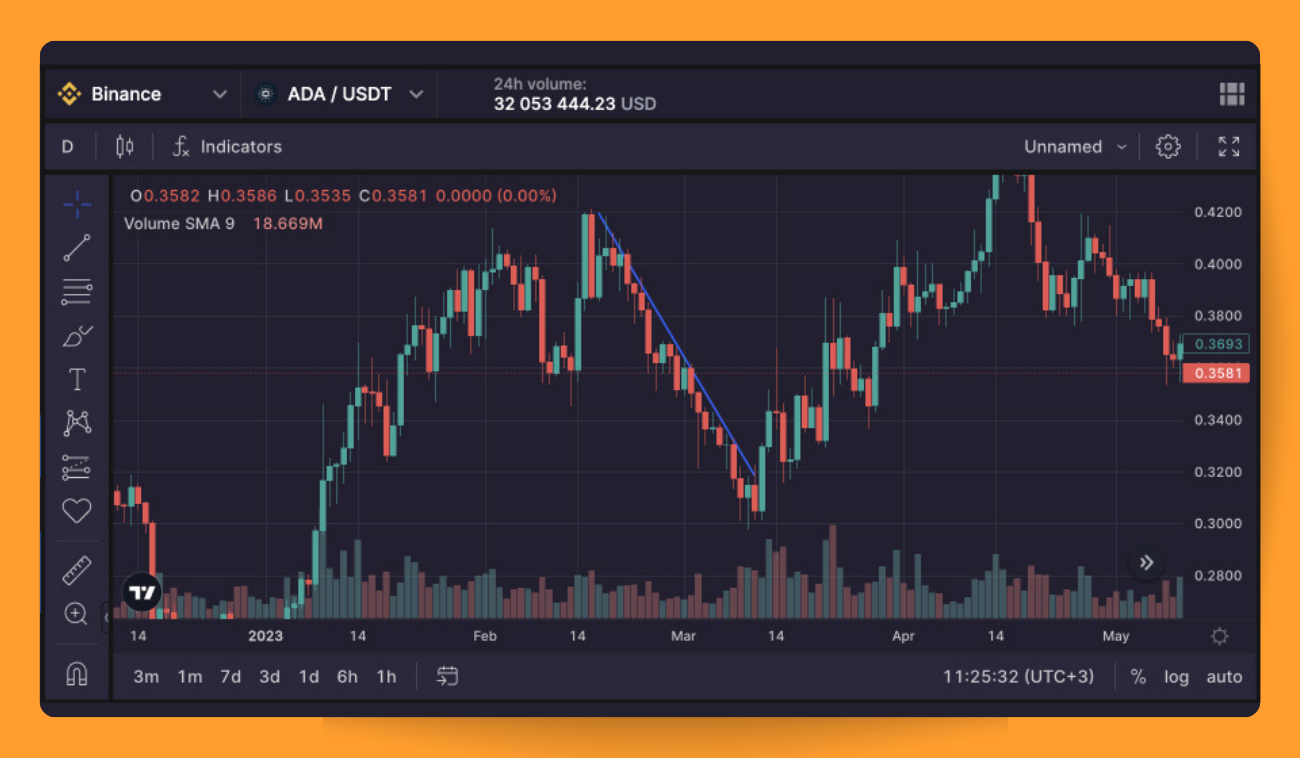
- Trendlines
Trendlines are similar to horizontal support and resistance but use sloping lines (Pic. 4).
A trendline connecting low prices over time shows the support level. A trendline connecting high prices shows the resistance level. When drawing trendlines, focus on at least 2–3 significant price points over the period. You can draw two parallel trendlines to identify a trading range.
- Pivot Points
Pivot points are a popular technical analysis tool to identify potential support and resistance levels. They are calculated using the high, low, and closing prices of a given trading period. These levels can also provide valuable insights into potential entry and exit points. The standard formula is: Pivot Point (PP) = (High + Low + Close) / 3
To calculate resistance/support levels, use these formulas:
- First support (S1) = (2 * PP) - High
- Second support (S2) = PP - (High - Low)
- Third support (S3) = Low - 2 * (High - PP)
- First resistance (R1) = (2 * PP) - Low
- Second resistance (R2) = PP + (High - Low)
- Third resistance (R3) = High + 2 * (PP - Low)
👉 For example, let's say the previous day's high was 1,534, the low was 1,480, and the closing price was 1,510. Then the pivot point would be (1,534 + 1,480 + 1,510)/3 = 1,508. Now, let’s calculate the first support and resistance levels. S1 would then be 1,482 (2*1,580 - 1,534), and R1 would be 1,536 (2*1,508 - 1,480). In the same fashion, using the formulas above, let’s calculate S2, R2, S3, and R3. S2 = 1,454, R2=1,562; S3=1,400, R3=1,616.
After you’ve done your math, add the calculated pivot point, support, and resistance levels to your price chart. Many trading platforms have built-in pivot point indicators that can do this automatically.
How to Draw Support and Resistance Crypto
To sketch support and resistance zones, simply draw a horizontal line through each meaningful trough (support) or peak (resistance).
Draw these lines through the bar lows (for support) or bar highs (for resistance) or the closing price, as most traders eye the close. Stretch these lines into the past to see if earlier price drops halted at the same level. (Pic. 5).
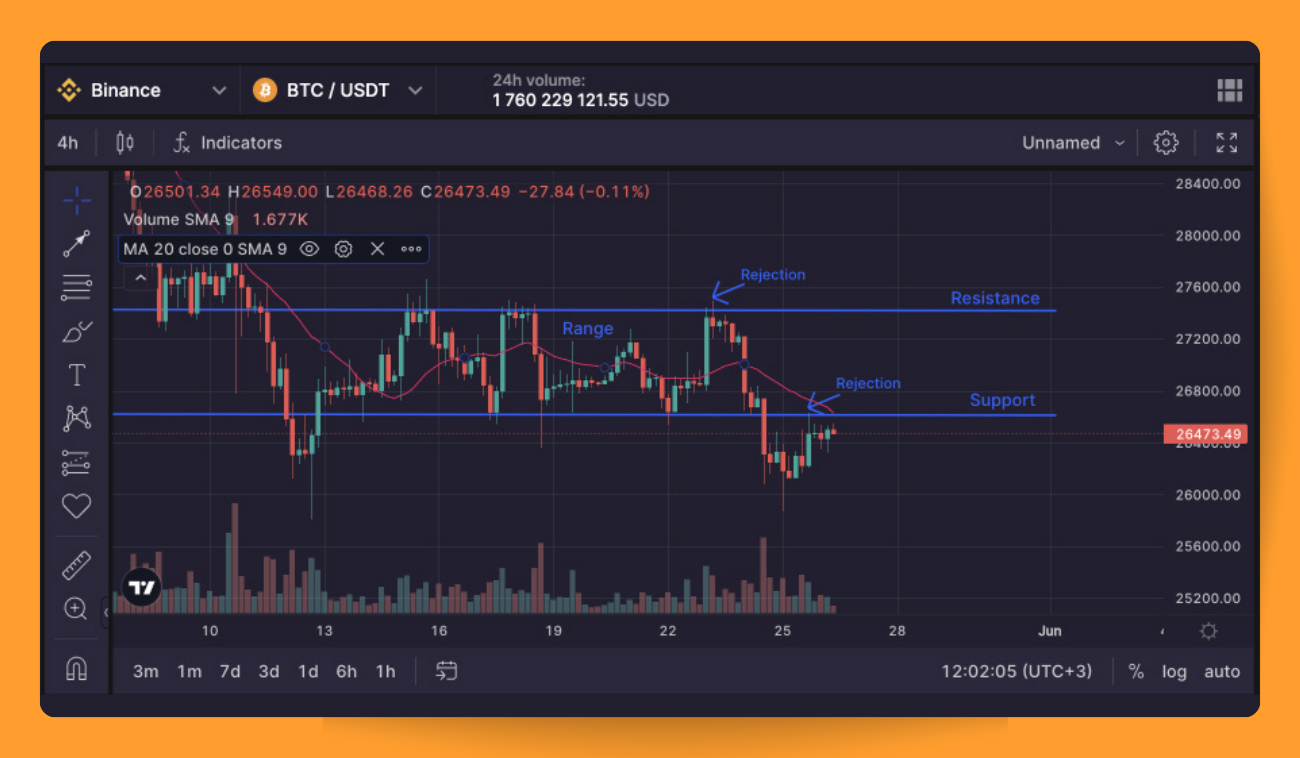
The more times a price level stopped past rises or backed past falls, the stronger that resistance or support may be in the future.
Here’s your brief, step-by-step guide to drawing (if you need one):
- Select the right time frame
First, determine your goals. For short-term trading, choose shorter time frames, and vice versa.
- Detect price zones
In your chosen time frame, you'll find clusters of huge price spikes and drops showing high volume. These often mark old support/resistance levels. Pinpoint three or more price zones to see how the asset performed.
- Draw the support and resistance lines
Join the price zones with a horizontal line. For upward-sloping zone patterns, the line is resistance. For downward-sloping zones, the line is support.
Well-drawn support and resistance lines signal an authoritative trading strategy. To improve accuracy, learn TradingView.
How Do You Use Support and Resistance for Crypto Trading?
Mastering support and resistance can give you the edge in the world of crypto trading. But first, make sure you have a rock-solid strategy in place before you dive in.
When the market is fluctuating in a range, you can buy near the support line with the expectation that the price will bounce back up. Then sell when it approaches the resistance level. This is a straightforward way to profit from the natural price cycles of a range-bound market. For the bold trader, you can also short sell near the resistance line and buy back at the support line.
If there is a strong trend, trendline trading is ideal. You can ride the momentum by buying whenever the price pulls back to the trendline. As the market bounces off the trendline, open a position in the direction of the trend. Close the position near the peak to lock in profits, then repeat the process.
Below are a few support and resistance strategies that can help you trade better:
- Score big by initiating long positions just above support levels. Snag your preferred cryptocurrency as the price rebounds off the support level to ride the upward trend wave.
- Minimize your risk by placing a stop-loss order right below the support level when buying, ensuring you're protected in case of a downtrend.
- Place a take-profit order just below the resistance level, automating your crypto sale once the target price is reached.
- If a crypto asset struggles to break through resistance multiple times, take it as a sign to close your long positions.
- Utilize resistance levels to pinpoint prime short selling moments. Enter a short position just below the resistance level, anticipating a price drop. But put a stop-buy order just above the resistance line, shielding yourself from excessive losses in case of an uptrend.
- Resistance levels are invaluable for intraday crypto trading. Strategically place a stop-sell or limit-sell order near the resistance level to book profits at the perfect time.
- Situate a buy order just above the support level when the stock hits the lower area of the support-resistance band.
What Happens When the Levels Are Broken?
It's tough to predict how high or low a crypto asset will go when support and resistance levels shatter. Expect a wild ride for a while as the market recalibrates and establishes fresh resistance and support levels based on the investor sentiment. Will the asset bounce back to previous levels or forge ahead even further? It’s challenging to tell which way the dust settles.
However, looking at long-term charts can help you forecast potential price moves based on how this asset responded to previous breaks. This insider intel can offer a baseline to strategize your next move and gauge the potential intensity of the break movement.
👉 Did the asset snap back quickly like an overstretched rubber band? Did it go on an extended run, carried away by greed and FOMO? The past patterns can at minimum establish a range of possibilities to guide your next move.
While unsettling, breakout moments also hold opportunity. The ability to think strategically is what separates the disciplined trader from the reckless gambler. So take a breath, consult the charts, and determine how you can profit from the frenzy.
What Happens When Support Becomes the Resistance?
Picture this: a particular cryptocurrency's value takes a nosedive, slipping below a critical point. Suddenly, the once-reliable support morphs into a stubborn resistance. If the dark cloud of negativity looms large after the support crumbles, the asset could spiral downwards, plunging into alarmingly treacherous territory.
The moral is that when a key support level fails, a swift and aggressive move may be required. You have two choices:
- Get out immediately before the break induces further selling. Then buy back in at a more attractive valuation once the dust settles.
- Or have the courage to buy during the frenzy, gambling that the break will be short-lived. But only do this if you have a strong conviction in the asset for the long term.
Popular Support and Resistance Indicators
Here’s our pick for the cream of the crop tools for spotting support and resistance:
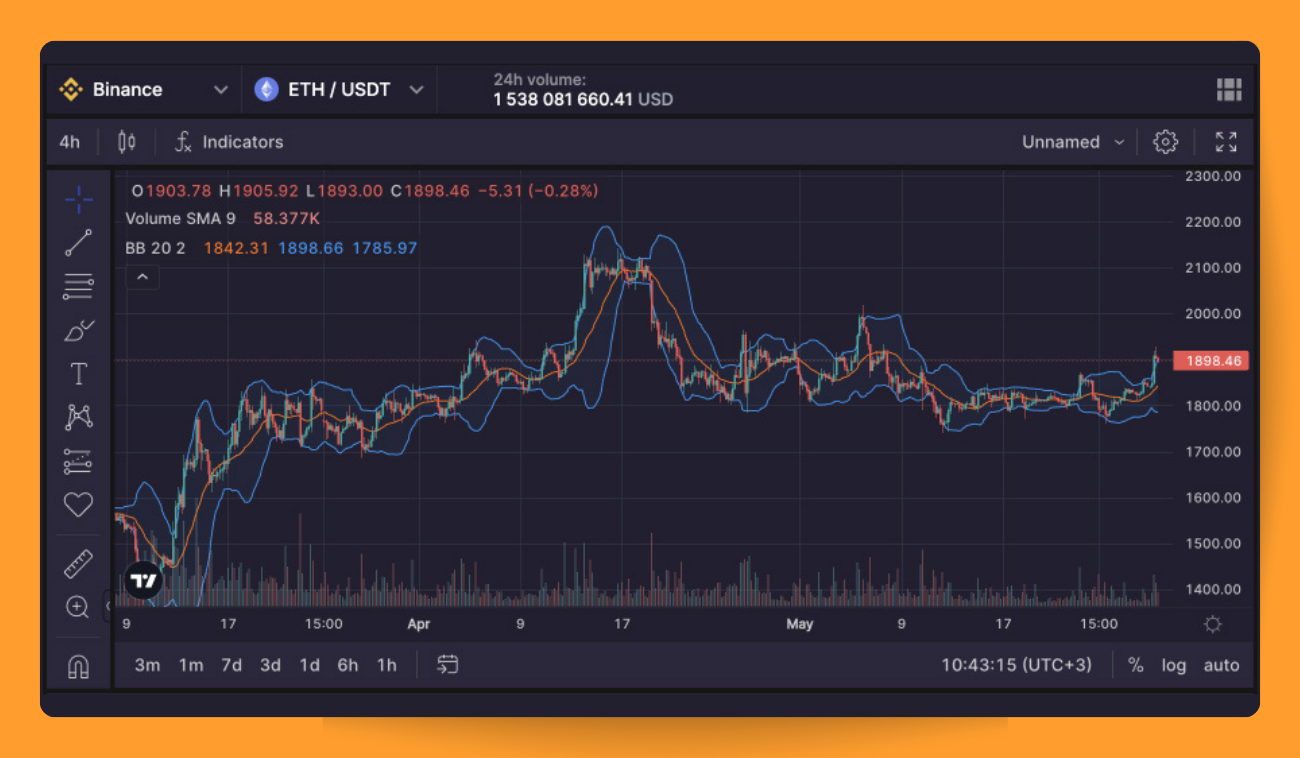
- Bollinger Bands (Pic. 6) — a trio of lines plotted over a steadfast 20-day period and crafted using volume-weighted moving averages. Melding seamlessly with Fibonacci retracements, it ranks among the most precise support and resistance zone indicators on the market.
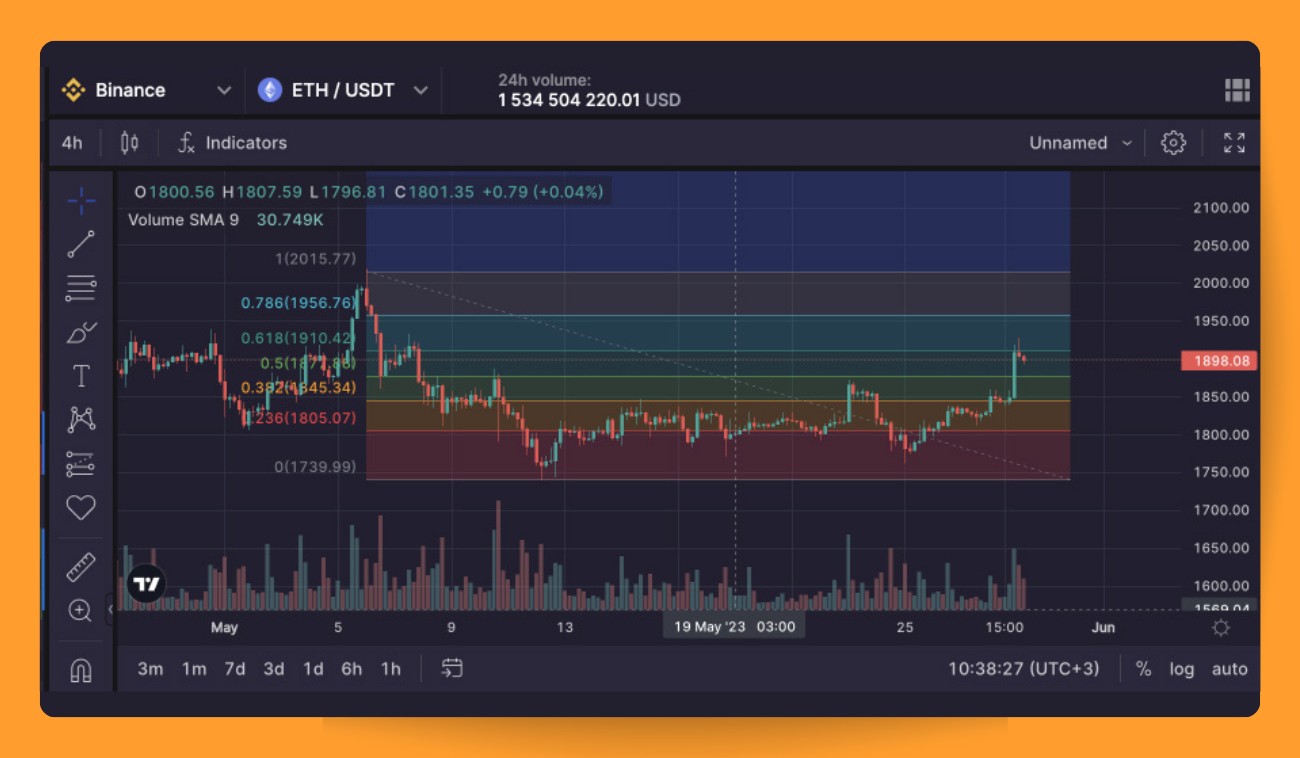
- The Fibonacci retracement has a fan club of its own, winning the hearts of numerous short-term traders for its uncanny ability to pinpoint potential support and resistance levels. While the intricate calculations behind this superstar indicator are beyond our current scope, just take a peek at the chart below (Pic. 7) and marvel at how the lines act as gatekeepers to the price's short-term trajectory. TradingView’s Fib retracement automatically traces the key Fibonacci ratios between any price high and low you specify. With a click of your mouse, TradingView does the magical math for you and plots the potential turning points on the chart.
Bitsgap + TradingView = Efficient Trading + Crypto Chart Analysis
Seeking top-notch tools to transform your trading research and skyrocket your crypto trading game? Look no further than the Bitsgap powerhouse.
The Bitsgap-TradingView combo is a match made in heaven. Say goodbye to juggling platforms and hello to one sleek, integrated experience:
- TradingView delivers fully customizable, stunning charts that'll make even the most experienced traders swoon. Choose from 9 types, including candles, bars, and Heikin Ashi. Deck out your charts with your go-to indicators, sketch patterns and trendlines, and even toss in emojis for the ultimate charting bliss!
- With Bitsgap's automation, trading becomes a breeze. Connect to more than 15 exchanges, use smart trading tools, trailing and hedging functions, and finally, entrust the bots with the heavy lifting while you bask in TradingView's rich analytics. Sounds good, isn’t it?
Go grab your seven-day free trial on a PRO plan now and chart your support and resistance levels while you may.
Support and Resistance vs Supply and Demand
Supply and demand levels and support and resistance levels are related but different concepts in trading:
- Supply and demand refers to the overall market forces of sellers (supply) and buyers (demand) for a stock or commodity. When demand is greater than supply, it leads to rising prices. When supply is greater than demand, it leads to falling prices. Supply and demand levels indicate price points where the supply and demand balance may shift.
- Support and resistance levels refer to price points that either catch and hold price from falling further (support) or restrict price from rising higher (resistance). These are psychological levels that traders watch and often react to.
Bottom Line: Cracking Crypto's Support & Resistance Code
As we wrap up this primer on support and resistance, remember that those levels are the lifeblood of your trading success. Mastering the skill of singling them out — or having a trusted expert by your side — is absolutely crucial.
Bear in mind that support and resistance levels offer a fleeting window for seizing profits, jumping in, or bowing out of trades. But, like shifting sands, they'll change with each and every breakout. So, embrace the challenge and watch your crypto profits soar to new heights!
FAQs
What Is a Support Level in Cryptocurrency Trading?
A crypto support level indicates a price that traders generally believe a cryptocurrency is unlikely to drop below. This level tends to be supported by strong demand and purchasing activity because traders view the asset as underpriced at that level. The support creates a floor that traders often see as an attractive buying opportunity or at least a safe zone for holding.
Most cryptocurrency day traders will monitor these support levels to determine key price ranges for the highs and lows. However, support levels can change quickly, and there is no guarantee how long a cryptocurrency will stay within a given support or resistance level before the price moves up or down.
How Can You Find the Support Level in Crypto?
The easiest support levels to spot are those that have held in the past. This past data can provide insight into where future support may emerge or potential dangers that may not show up on a smaller time scale. But support analysis is challenging to do accurately in real time. While spotting support within your usual trading window is important, zoom out to look at the bigger picture. The overall trend and longer-term historical price action provide important context for determining support levels that may actually hold in the future.
What Is Crypto Resistance Level Meaning?
Resistance levels indicate prices where selling pressure may stall an uptrend temporarily. Cryptocurrency traders watch resistance levels for signs that buying power will overcome this barrier, allowing the price to break through and rise further. However, at resistance levels, other traders are selling or closing out short positions, acting as resistance to price increases.
For a cryptocurrency to continue rising in value, it must break through this resistance. This requires absorbing all the sell orders at that price level so that a new, higher support level can form. Once price pushes through resistance, it signals to the market that buyers are in control and the uptrend is continuing. This often sparks more buying interest that will then provide support at the former resistance level.
How Can You Identify the Resistance Level?
The simplest way for traders to spot resistance levels is to analyze the price chart and draw horizontal lines connecting previous price peaks. This helps identify the prevailing trend and determine optimal entry and exit points for profitable trades.
When a cryptocurrency breaks through resistance, the former resistance level often becomes the new support level if buying pressure is substantial enough. Breaking resistance indicates greater demand and uptrend momentum, so the price tends to find support at the former resistance.
What Are Support and Resistance Trend Lines?
Support and resistance trend lines are horizontal price levels drawn at previous market peaks and troughs on a chart. Traders use these lines to identify potential support and resistance levels for a cryptocurrency.
Learning to properly draw support and resistance lines is one of the first technical analysis skills you should acquire. With trading tools like Bitsgap, you can draw trend lines directly on live charts. You can also practice technical analysis using a Bitsgap demo account until you are ready to trade with real money.
Do Support and Resistance Levels Work for Bitcoin Only?
All tradable assets, including bitcoin, will have support and resistance levels. However, how prices react at these levels can differ for each asset. You must spend time analyzing the specific cryptocurrencies you want to trade to understand their patterns and tendencies.