
Ditch the Deals, Grab the Gains! Bitsgap's Black Friday: Power Up Your Plan
Forget the Black Friday frenzy. This year, skip the lines and invest in something that truly pays off: your trading future. Bitsgap's Black Friday upgrade event is here, offering you a game-changing 50% discount on our annual Advanced and PRO plans.

Trade Evedex Futures on Bitsgap: A New Era of Decentralized Trading
Meet Evedex on Bitsgap - the new era of decentralized futures trading. Evedex merges DEX transparency with CEX speed, offering non-custodial trading, no KYC, and smart COMBO bot automation. Connect Evedex to Bitsgap and trade securely with full control today.

Best Indicators for Identifying Crypto Breakouts
Crypto breakouts occur when prices move sharply beyond key support or resistance levels. Learn how indicators like RSI, MACD, Bollinger Bands, and Volume Analysis can help you identify real breakouts, filter false signals, and spot profitable trading opportunities in time.

Auto-Trading vs Manual Trading: Which Fits Your Lifestyle?
Auto-trading vs manual trading — which suits your lifestyle best? Explore how automation saves time and removes emotions, while manual trading offers full control and flexibility. Find the perfect balance for your strategy and goals.

Auto-Trading vs Manual Trading: Which Fits Your Lifestyle?
Auto-trading vs manual trading — which suits your lifestyle best? Explore how automation saves time and removes emotions, while manual trading offers full control and flexibility. Find the perfect balance for your strategy and goals.

Unraveling the Mystique: Understanding the Bitcoin Rainbow Chart and Its Implications in Cryptocurrency Trading
The Bitcoin Rainbow Chart visualizes BTC’s long-term price movements through colorful bands, showing market phases from undervalued to overvalued. Learn how traders interpret it to identify cycles, spot opportunities, and avoid emotional decisions.
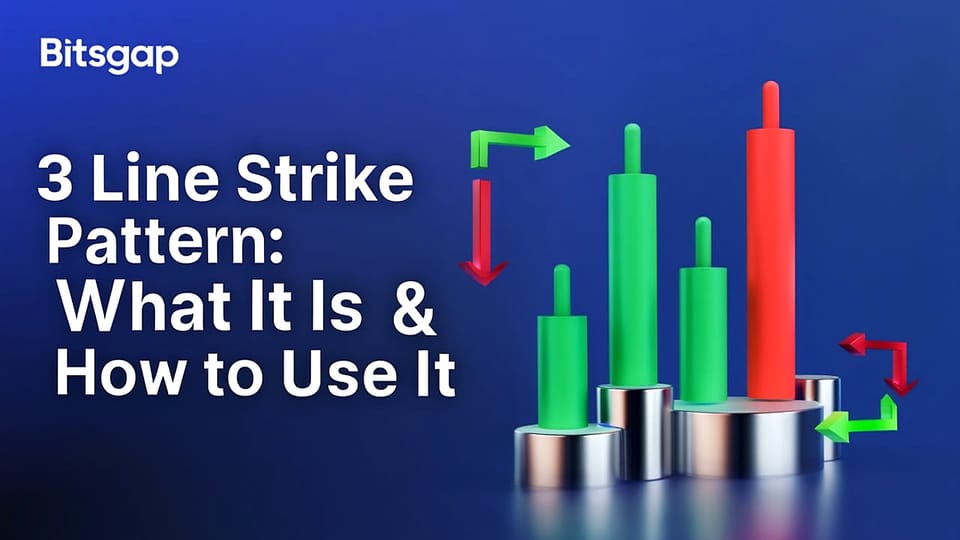
What is the 3 Line Strike Pattern and How to Use It in Trading
The 3 Line Strike Pattern is a four-candle formation signaling potential market reversals. This guide explains how to identify it, interpret its meaning, and use it in your trading strategy for timely entry and exit decisions.

What is the 3 Line Strike Pattern and How to Use It in Trading
The 3 Line Strike Pattern is a four-candle formation signaling potential market reversals. This guide explains how to identify it, interpret its meaning, and use it in your trading strategy for timely entry and exit decisions.
Search
Page 1 of 64
