
Understanding Fibonacci Retracement Levels
Discover how Fibonacci retracement levels can help you spot key price zones, predict market reversals, and execute your trading strategies with precision.
What do a 13th-century mathematician, the natural growth patterns in plants, and modern cryptocurrency trading have in common? The answer lies in a fascinating sequence of numbers that has captivated minds for centuries and now serves as a powerful tool in technical analysis.
Fibonacci trading, particularly through the use of Fibonacci retracements, has become a cornerstone strategy for crypto traders looking to navigate the volatile waters of digital assets. These mathematical relationships have an almost mystical way of predicting potential reversal points in price movements—levels where assets often bounce back or reverse course, as if guided by an invisible hand.
In this comprehensive guide, we'll unravel the mystery behind these golden ratios and show you how they can transform your approach to cryptocurrency trading. From understanding the basic principles of Fibonacci retracements to applying them in real-world trading scenarios, we'll equip you with the knowledge to spot potential turning points in the market before they happen.
Who Was Fibonnaci? How Did Fibonnacci Come About?
Leonardo Fibonacci wasn't just another medieval mathematician—he was the man who revolutionized Western mathematics and, unknowingly, laid the groundwork for tools that traders would use centuries later. Born around 1170 in Pisa, Italy, Fibonacci traveled extensively throughout the Mediterranean as a young man, particularly spending time in North Africa where his father worked as a customs official.
It was during these travels that Fibonacci encountered the Hindu-Arabic numeral system—the 0-9 digits we use today. At the time, Europe was still struggling with clumsy Roman numerals. Recognizing the superior efficiency of this system, Fibonacci introduced it to Europe through his groundbreaking book "Liber Abaci" (The Book of Calculation) in 1202.
👉 But Fibonacci's most famous contribution came from a seemingly simple question in this same book: "How many pairs of rabbits can be produced from a single pair in one year?" This puzzle would lead to the discovery of what we now know as the Fibonacci sequence, a pattern that would later be found throughout nature, art, architecture, and eventually, financial markets.
What Is the Fibonacci Sequence and How Does It Work?
The Fibonacci sequence is deceptively simple: each number is the sum of the two preceding ones. Starting from 0 and 1, the sequence goes:
0, 1, 1, 2, 3, 5, 8, 13, 21, 34, 55, 89, 144…
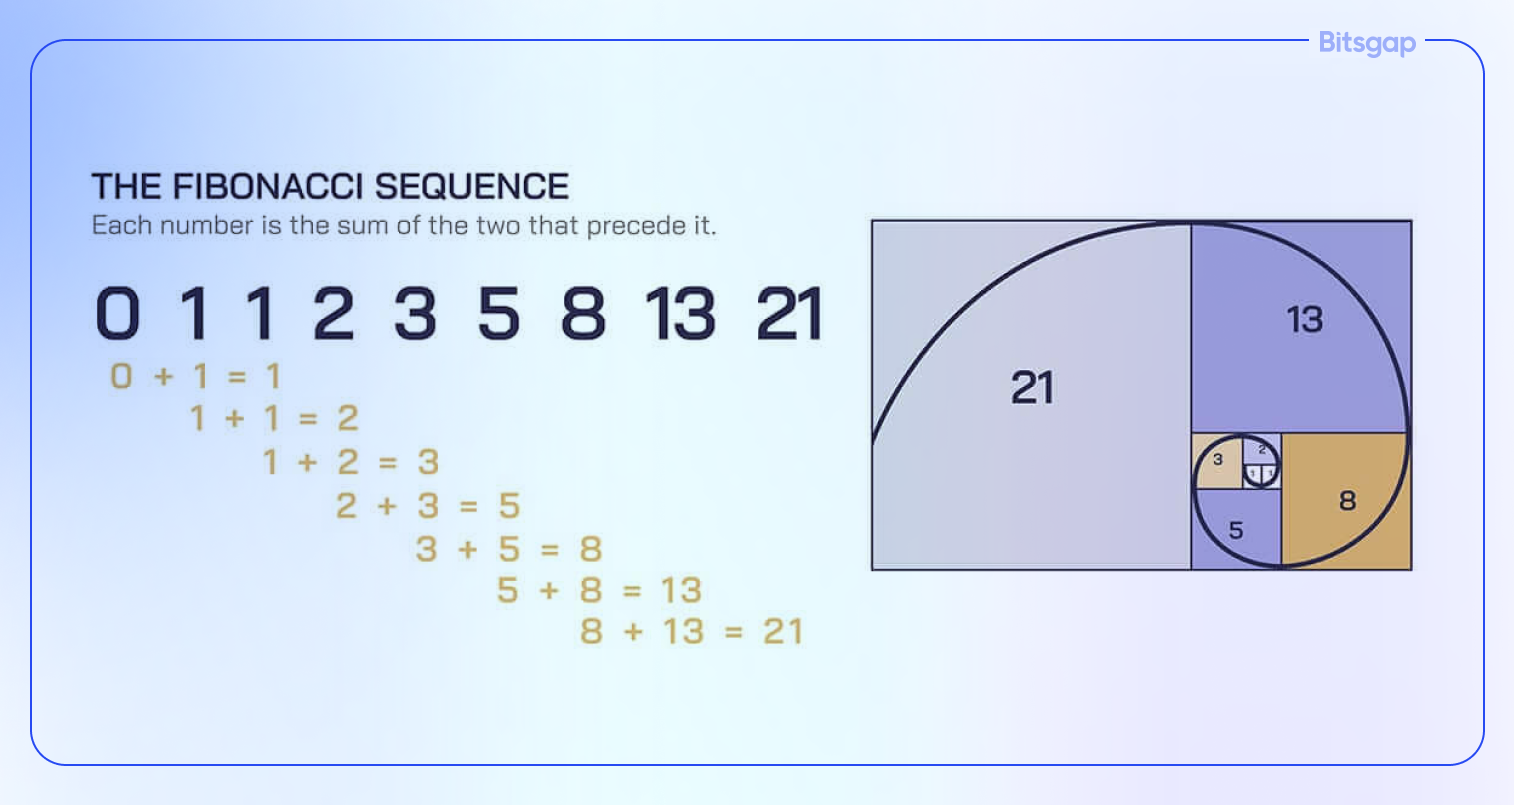
What makes this sequence remarkable isn't just its mathematical elegance, but its uncanny appearance in natural phenomena. The spiral arrangement of leaves on plants, the branching of trees, the shell of a nautilus, and even the arrangement of seeds in a sunflower all follow patterns based on Fibonacci numbers.
Even more fascinating is the relationship between consecutive Fibonacci numbers. As the sequence progresses, dividing each number by its predecessor yields a value that increasingly approaches 1.618033988...—known as the Golden Ratio or φ (phi). This ratio appears so frequently in natural growth patterns that it's often called "nature's favorite number."
The inverse of this ratio (0.618) and other common ratios derived from the sequence (0.236, 0.382, 0.786) form the basis of Fibonacci retracement levels in trading. These aren't arbitrary numbers – they represent mathematical relationships that have been observed in natural growth and decline patterns for centuries.
👉 When applied to financial markets, these ratios help identify potential support and resistance levels where price movements might reverse or pause. The theory suggests that markets, being driven by human behavior and natural cycles of growth and retracement, often respect these same mathematical relationships that appear throughout nature.
What Is Fibonacci in Trading Crypto?
In cryptocurrency trading, Fibonacci refers to a powerful technical analysis method that helps traders identify potential price reversal points and set strategic entry and exit positions. Unlike traditional technical indicators that rely solely on price and volume data, Fibonacci trading taps into mathematical relationships that have shown remarkable accuracy in predicting market behavior.
The beauty of Fibonacci in crypto trading lies in its versatility and universal application. Whether you're trading Bitcoin during a volatile bull run or analyzing altcoin movements in a bear market, these mathematical principles remain relevant. Traders use Fibonacci tools to identify key price levels where a crypto asset might find support during downtrends or encounter resistance during uptrends.
What Is Fibonacci Sequence Trading?
Fibonacci sequence trading is a methodology that applies the mathematical principles of the Fibonacci sequence to identify potential turning points in cryptocurrency price action. At its core, this approach is based on the observation that markets often retrace a predictable portion of a move, following ratios derived from the Fibonacci sequence.
This trading method operates on the premise that after a significant price movement (either up or down), cryptocurrency prices tend to retrace by certain predictable percentages before continuing in the original direction. These percentage levels, derived from the Fibonacci ratios (23.6%, 38.2%, 61.8%, etc.), often act as psychological price barriers where market participants make key trading decisions.
What Are Fibonacci Retracement Levels?
Fibonacci retracement levels are horizontal lines on a price chart that indicate where support and resistance are likely to occur. These levels are calculated by first identifying a major peak and trough on the chart, then dividing the vertical distance by key Fibonacci ratios. The most commonly used Fibonacci retracement levels in crypto trading are:
- 23.6%: The shallowest retracement, often seen in strong trends
- 38.2%: A moderate retracement level where many price reversals occur 5
- 0.0%: While not a Fibonacci ratio, this midpoint is psychologically important
- 61.8%: The golden ratio, considered the most significant retracement level
- 78.6%: A deep retracement, often the last line of defense before trend reversal
- 100%: Complete retracement to the starting point
These levels are particularly valuable in cryptocurrency markets because they often become self-fulfilling prophecies. Since many traders watch and place orders around these levels, they naturally become points where supply and demand forces concentrate. For example, during a Bitcoin bull run, traders might look to buy at the 38.2% or 61.8% retracement levels, creating natural support zones at these prices.
👉 What makes these levels especially powerful in crypto trading is their ability to work across different timeframes and price ranges. Whether you're analyzing a 5-minute chart for day trading or a weekly chart for long-term investment decisions, these same Fibonacci ratios maintain their relevance and can help identify critical price levels where the market might react.
How Do Fibonacci Retracement Levels Work?
Fibonacci retracement levels work by identifying potential reversal points in price movements based on mathematical ratios derived from the Fibonacci sequence. These levels act like a framework for understanding how far a price might "retrace" after making a significant move.
👉 Think of it like a rubber band: when prices make a strong move in one direction, they often snap back partially before continuing the trend. These retracement levels help predict where that snapback might stop. The key levels (23.6%, 38.2%, 50%, 61.8%, and 78.6%) represent possible turning points where buyers or sellers might step in.
How to Use Fibonacci Retracement Levels in Crypto Trading
To apply Fibonacci retracements in cryptocurrency trading, follow these essential steps:
- Identify the Trend: First, find a clear uptrend or downtrend in your chosen timeframe.
- Select Your Points: Choose the trend's starting point (swing low) and ending point (swing high). For uptrends, draw from bottom to top; for downtrends, draw from top to bottom.
- Apply the Tool: Your trading platform will automatically calculate and display the retracement levels between these points.
- Watch for Confluence: The most powerful signals occur when Fibonacci levels align with other technical indicators like moving averages or support/resistance levels.
- Plan Your Trades: Use these levels to set entry points, stop losses, and take-profit targets. For example, you might buy at a 61.8% retracement with a stop loss just below the 78.6% level.
Fibonacci Levels in Uptrend
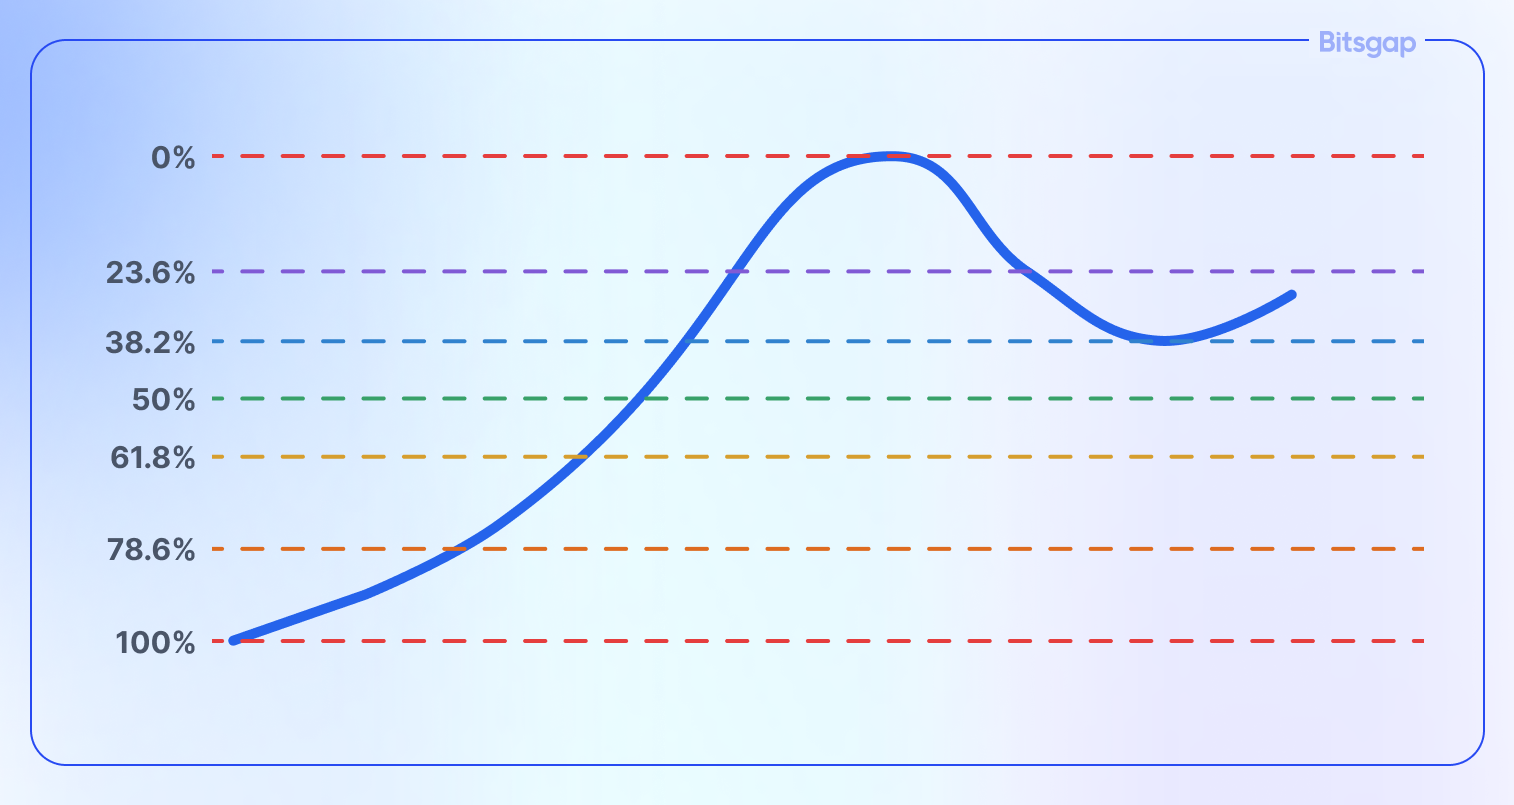
During an uptrend, Fibonacci retracement levels help identify potential support areas where buyers might re-enter the market. Here's how to interpret them:
- 23.6%: Shallow retracement, common in strong uptrends
- 38.2%: Moderate pullback, often seen in healthy uptrends
- 50.0%: Psychological midpoint, significant support level
- 61.8%: Golden ratio retracement, major support level
- 78.6%: Deep retracement, might signal trend weakness
👉 For example, if Bitcoin rises from $30,000 to $50,000, traders might look to buy at the 38.2% retracement level around $42,380, expecting the uptrend to continue from there.
Fibonacci Levels in Downtrend
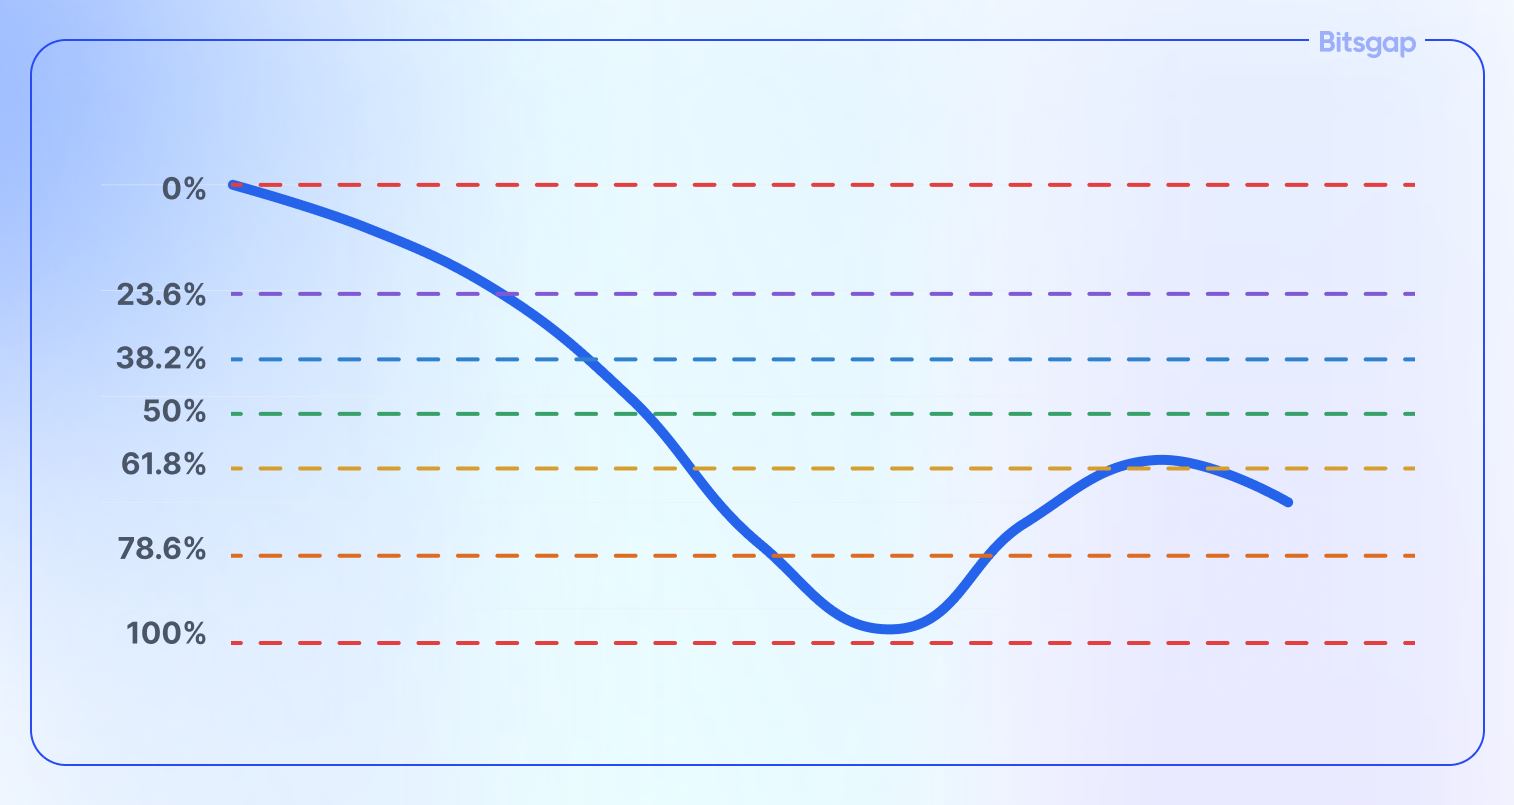
In a downtrend, these same levels act as potential resistance points where sellers might re-enter. The interpretation is reversed:
- 23.6%: Minor resistance in strong downtrends
- 38.2%: Common selling point for bearish traders
- 50.0%: Major psychological resistance
- 61.8%: Key resistance level, often caps bounces
- 78.6%: Deep bounce, might signal trend exhaustion
👉 For instance, if Ethereum drops from $4,000 to $2,000, traders might look to sell at the 38.2% retracement level around $2,764, anticipating the continuation of the downtrend.
Fibonacci Support & Resistance Zones
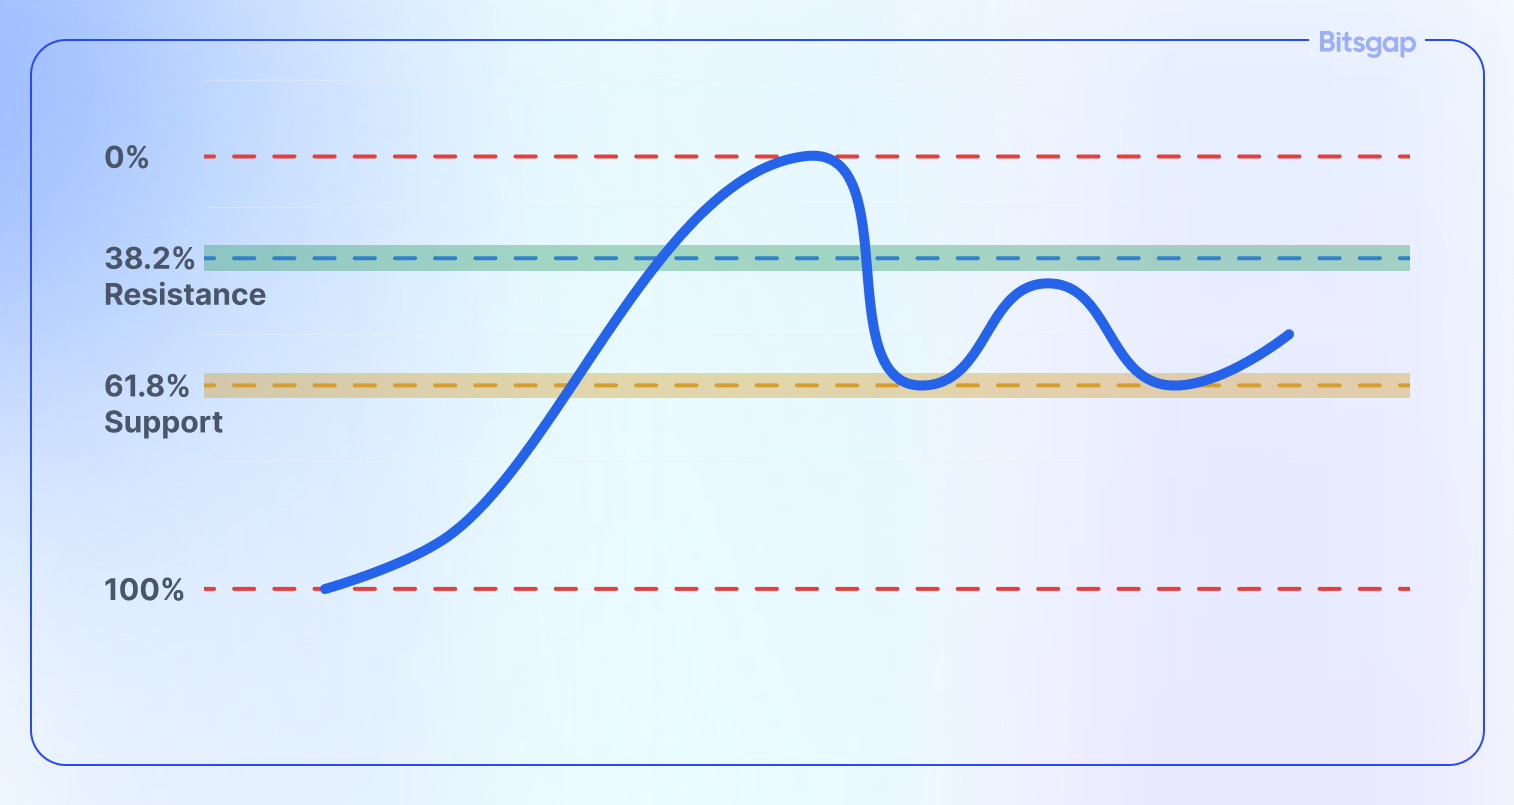
Rather than treating Fibonacci levels as exact prices, successful traders view them as zones of interest. These zones often become self-fulfilling prophecies in crypto markets because:
- Market Memory: Previous reaction points tend to influence future trading decisions
- Algorithmic Trading: Many trading bots are programmed to react at these levels
- Crowd Psychology: Large numbers of traders watching the same levels creates natural support/resistance
The most reliable support and resistance zones typically occur at:
- The 38.2% level, which often acts as the first major resistance during bounces
- The 61.8% level, considered the last line of defense before a trend reversal
- The 50% level, which frequently serves as a pivot point where the market decides the next direction
👉 Remember that these zones become more significant when they align with other technical factors like round numbers, previous support/resistance levels, or major moving averages. For example, if the 61.8% Fibonacci retracement level coincides with Bitcoin's 200-day moving average, that zone becomes an especially important area to watch for potential reversals.
How Do You Apply Fibonacci Retracement Levels in a Chart?
Applying Fibonacci retracement levels to your cryptocurrency charts involves a systematic approach that combines technical accuracy with strategic timing. Here's a comprehensive breakdown of the process:
- Choose the Right Timeframe
- Select a timeframe that matches your trading strategy (e.g., 4H for swing trades, 1D for longer positions)
- Ensure the trend you're analyzing is clear and significant
- Look for moves that show a strong directional bias
- Identify the Major Move
- Find a significant price movement (swing move)
- Look for clear swing highs and swing lows
- Make sure the move you're measuring isn't chopped up by multiple reversals
- Confirm the Trend
- Uptrend: Series of higher highs and higher lows
- Downtrend: Series of lower highs and lower lows
- The move should be clean and decisive
- Apply Additional Confirmation Tools
- Volume analysis to validate the strength of the move
- Key support/resistance levels
- Moving averages or other technical indicators
How Do You Draw a Fibonacci Retracement?
Drawing Fibonacci retracements correctly is crucial for accurate analysis. Here's your step-by-step guide:
- For an Uptrend:
- Start at the significant low (swing low)
- Drag your Fibonacci tool up to the significant high (swing high)
- The tool will automatically plot retracement levels downward
- For a Downtrend:
- Start at the significant high (swing high)
- Drag your Fibonacci tool down to the significant low (swing low)
- The tool will automatically plot retracement levels upward
Common Mistakes to Avoid:
- Don't draw Fibonacci levels on choppy or sideways price action
- Avoid using multiple Fibonacci retracements that conflict with each other
- Don't force Fibonacci levels onto small, insignificant price moves
Pro Tips for Drawing Fibonacci Retracements:
- Fine-Tune Your Starting Points
- Use the wick of the candle for more precise measurement
- Consider using the closing price if it better represents the actual reversal point
- Look for clear pivot points rather than arbitrary highs and lows
- Multiple Timeframe Analysis
- Draw Fibonacci levels on higher timeframes first
- Confirm these levels with lower timeframe price action
- Look for confluence across different timeframes
- Adaptive Adjustment
- Be ready to redraw your levels if the market structure changes
- Don't cling to outdated Fibonacci levels if new swing highs or lows form
- Regular review and adjustment of your levels is essential
- Practice Tips for Beginners
- Start by drawing Fibonacci retracements on historical data
- Document which levels worked best in different scenarios
- Begin with major market moves before attempting to analyze smaller fluctuations
👉 Remember: Fibonacci retracements are most effective when used as part of a complete trading strategy, not in isolation. They should complement your existing technical analysis tools and help confirm potential entry and exit points rather than being the sole basis for trading decisions.
Practical Example of Drawing Fibonacci Retracements on the Bitsgap Platform
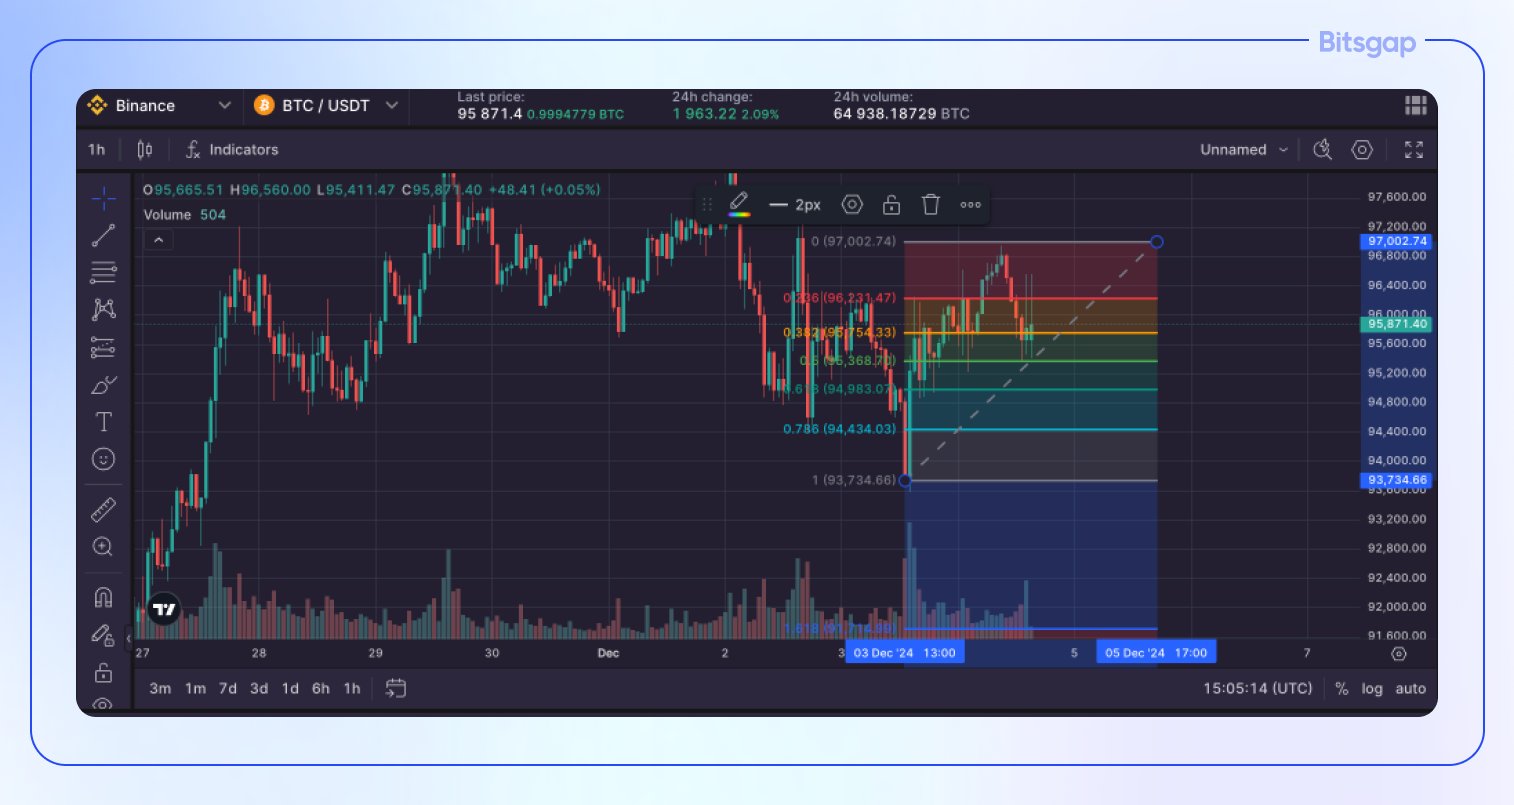
If you’re searching for a platform with advanced technical charting, intuitive trading tools like smart orders and automation for both spot and futures markets, Bitsgap has you covered. This robust crypto trading platform and aggregator seamlessly integrates with over 15 exchanges, offering everything you need in one place. Sign up for free today and enjoy a 7-day trial to explore its features.
Now, let’s dive right in. The image above illustrates Fibonacci retracement levels on a 1-hour BTC/USDT chart, plotted between the swing high of 97,002.74 and the swing low of 93,734.66:
- 0%: 97,002.74 (Swing High)
- 0.236: 96,231.47
- 0.382: 95,754.33
- 0.5: 95,368.70
- 0.618: 94,983.07
- 0.786: 94,434.03
- 1 (or 100%): 93,734.66 (Swing Low)
Looking at the chart, we can observe the following:
- Price Action: The price has recently bounced off the 0.786 Fibonacci level (around 94,434.03) and is currently trading slightly above the 0.618 level (around 94,983.07). This suggests some buying pressure at these lower levels.
- Volume: The volume bars at the bottom of the chart appear relatively consistent, without any significant spikes during the recent price swings. This could indicate a lack of strong conviction in either direction. However, the volume preceding the swing high appears higher than the volume during the retracement. This could suggest a weakening of the upward momentum.
- Fibonacci Confluence: The 0.618 and 0.786 Fibonacci levels are considered significant support/resistance zones. The bounce from the 0.786 level reinforces its importance.
Possible Scenarios and Predictions:
- Bullish Scenario: If the price can hold above the 0.618 Fibonacci level and show increasing volume, it could signal a potential reversal and a move towards the 0.5 (95,368.70), 0.382 (95,754.33), and eventually back towards the recent high.
- Bearish Scenario: If the price breaks down below the 0.786 Fibonacci level with increasing volume, it could signal a continuation of the downtrend, targeting the swing low at 93,734.66 and potentially even lower.
- Sideways Consolidation: Given the relatively consistent volume and the price hovering around the Fibonacci levels, the market could also enter a period of sideways consolidation between the 0.618 and 0.786 levels before making a decisive move in either direction.
The key levels to watch on this BTC/USDT chart, based on the drawn Fibonacci retracement, are:
- 0.786 Fibonacci Level (94,434.03): This level has already proven its significance as support, with the price bouncing off it recently. A break below this level with significant volume could signal a continuation of the downtrend. Conversely, a sustained hold above this level could indicate a potential reversal.
- 0.618 Fibonacci Level (94,983.07): This is another crucial Fibonacci level. The price is currently trading slightly above it. If the price consolidates above this level with increasing volume, it could suggest growing bullish momentum. A break below, however, could lead to a retest of the 0.786 level.
- 0.5 Fibonacci Level (95,368.70): This level represents the midpoint of the retracement and often acts as a strong support or resistance. If the price breaks above the 0.618 level, the 0.5 level becomes the next target for bullish traders.
- 0.382 Fibonacci Level (95,754.33): This level could act as resistance if the price starts to recover. A break above this level would further strengthen the bullish case.
- Swing High (97,002.74): This is the recent high and a significant resistance level. A break above this high would confirm a bullish breakout and potentially signal a continuation of the prior uptrend.
- Swing Low (93,734.66): This is the recent low and a crucial support level. A break below this low would confirm a bearish breakdown and could lead to further downside.
👉 NB: This analysis is based solely on the chart above. Other factors, such as news events, market sentiment, and technical indicators, can significantly influence price action. It's crucial to conduct your own thorough research and risk management before making any trading decisions.
Conclusion
The marriage of ancient mathematics and modern cryptocurrency trading might seem unlikely at first glance, but Fibonacci's mathematical principles have proven themselves remarkably relevant in today's digital asset markets. From a simple sequence of numbers discovered in the 13th century to a sophisticated trading tool used by professionals worldwide, Fibonacci's legacy continues to influence how we understand market movements.
Fibonacci retracement levels provide traders with a structured approach to identifying potential reversal points in price action. These mathematical relationships—the 23.6%, 38.2%, 50%, 61.8%, and 78.6% levels—often act as psychological barriers where market participants make crucial decisions. In the volatile cryptocurrency markets, where traditional valuation methods may fall short, these levels offer valuable reference points for entry and exit strategies.
What makes Fibonacci analysis particularly powerful in cryptocurrency trading is its self-fulfilling nature. As more traders and algorithmic systems incorporate these levels into their strategies, they become increasingly relevant. The crypto market's 24/7 nature and high volatility make it especially receptive to technical analysis tools like Fibonacci retracements, which help traders make sense of rapid price movements and identify potential turning points.
For traders looking to take their technical analysis to the next level, Bitsgap offers an advanced trading platform with superior charting tools and automation capabilities. The platform's integrated Fibonacci tools, combined with its comprehensive suite of technical indicators and automated trading strategies, provide traders with everything they need to apply Fibonacci analysis effectively in their cryptocurrency trading journey.
