
RSI Crypto Trading: How Does the RSI Indicator Work in Crypto?
Want to master RSI? You’re in for a lucky treat. This guide will help you expertly wield RSI’s power to pinpoint lucrative opportunities, recognize trend shifts, and guide strategic buy/sell decisions.
Buckle up as we dive into crypto's most versatile momentum oscillator — the Relative Strength Index (RSI) indicator.
Before you dive into the deep end of the trading pool, you'll need to pinpoint the perfect entry point and suss out whether that pesky trend will continue or reverse course. After all, your ultimate success hinges on your market analysis prowess.
While you can certainly dip your toes into the realm of fundamental analysis, technical analysis is where the real magic happens. Armed with the power of historical crypto quotes and a cyclical understanding of demand ebbs and flows, you'll be ready to conquer the trading world — one mathematical indicator at a time!
Enter the RSI, a fan-favorite momentum oscillator that's impossible to ignore.
In this article, we'll explore the thrilling ins and outs of this trading dynamo, including strategies, pros, cons, and everything in between.
What Is RSI Indicator in Cryptocurrency Trading
The Relative Strength Index (RSI) is a crypto trading's go-to technical analysis tool for gauging market momentum. By assessing whether crypto assets are overvalued or undervalued, the RSI zeroes in on recent price changes' speed and magnitude.
👉 The brainchild of J. Welles Wilder Jr, this nifty oscillator (scaled from 0 to 100) first made waves in his 1978 book, "New Concepts in Technical Trading Systems." Wilder coined this term to describe the ratio between average price increases and decreases over a specific time frame. An analysis of this relative magnitude allowed Wilder to determine if buyers or sellers held sway over the price during that span, helping him uncover insights into potential future trends.
Beyond predicting trend reversals and corrective price pullbacks, the RSI also serves up valuable buy and sell signals.
How Does RSI Crypto Work
Traditionally, RSI tracks price fluctuations in stocks or crypto assets over 14 periods, which can span days, hours, or weeks. The RSI calculation formula looks like this:
RSI = 100 − [100/(1 + RS)]
RS = Average Gain/Average Loss
Average Gain = Sum of gain per period/time frame
Average Loss = Sum of loss per period/time frame
This equation calculates RSI by dividing the 14-period average gain by the absolute value of the average loss.
👉 Traders rely on RSI to pinpoint overbought or oversold market conditions. A rising momentum pushes the RSI above 70, signaling active buying. Conversely, a falling momentum drops the RSI below 30, indicating declining interest and mounting selling pressure.
While RSI typically employs 14 periods, traders can tweak this value to increase or decrease sensitivity to trends.
Luckily, trading platforms, such as Bitsgap’s, provide ready-made access to RSI, sparing you the math.
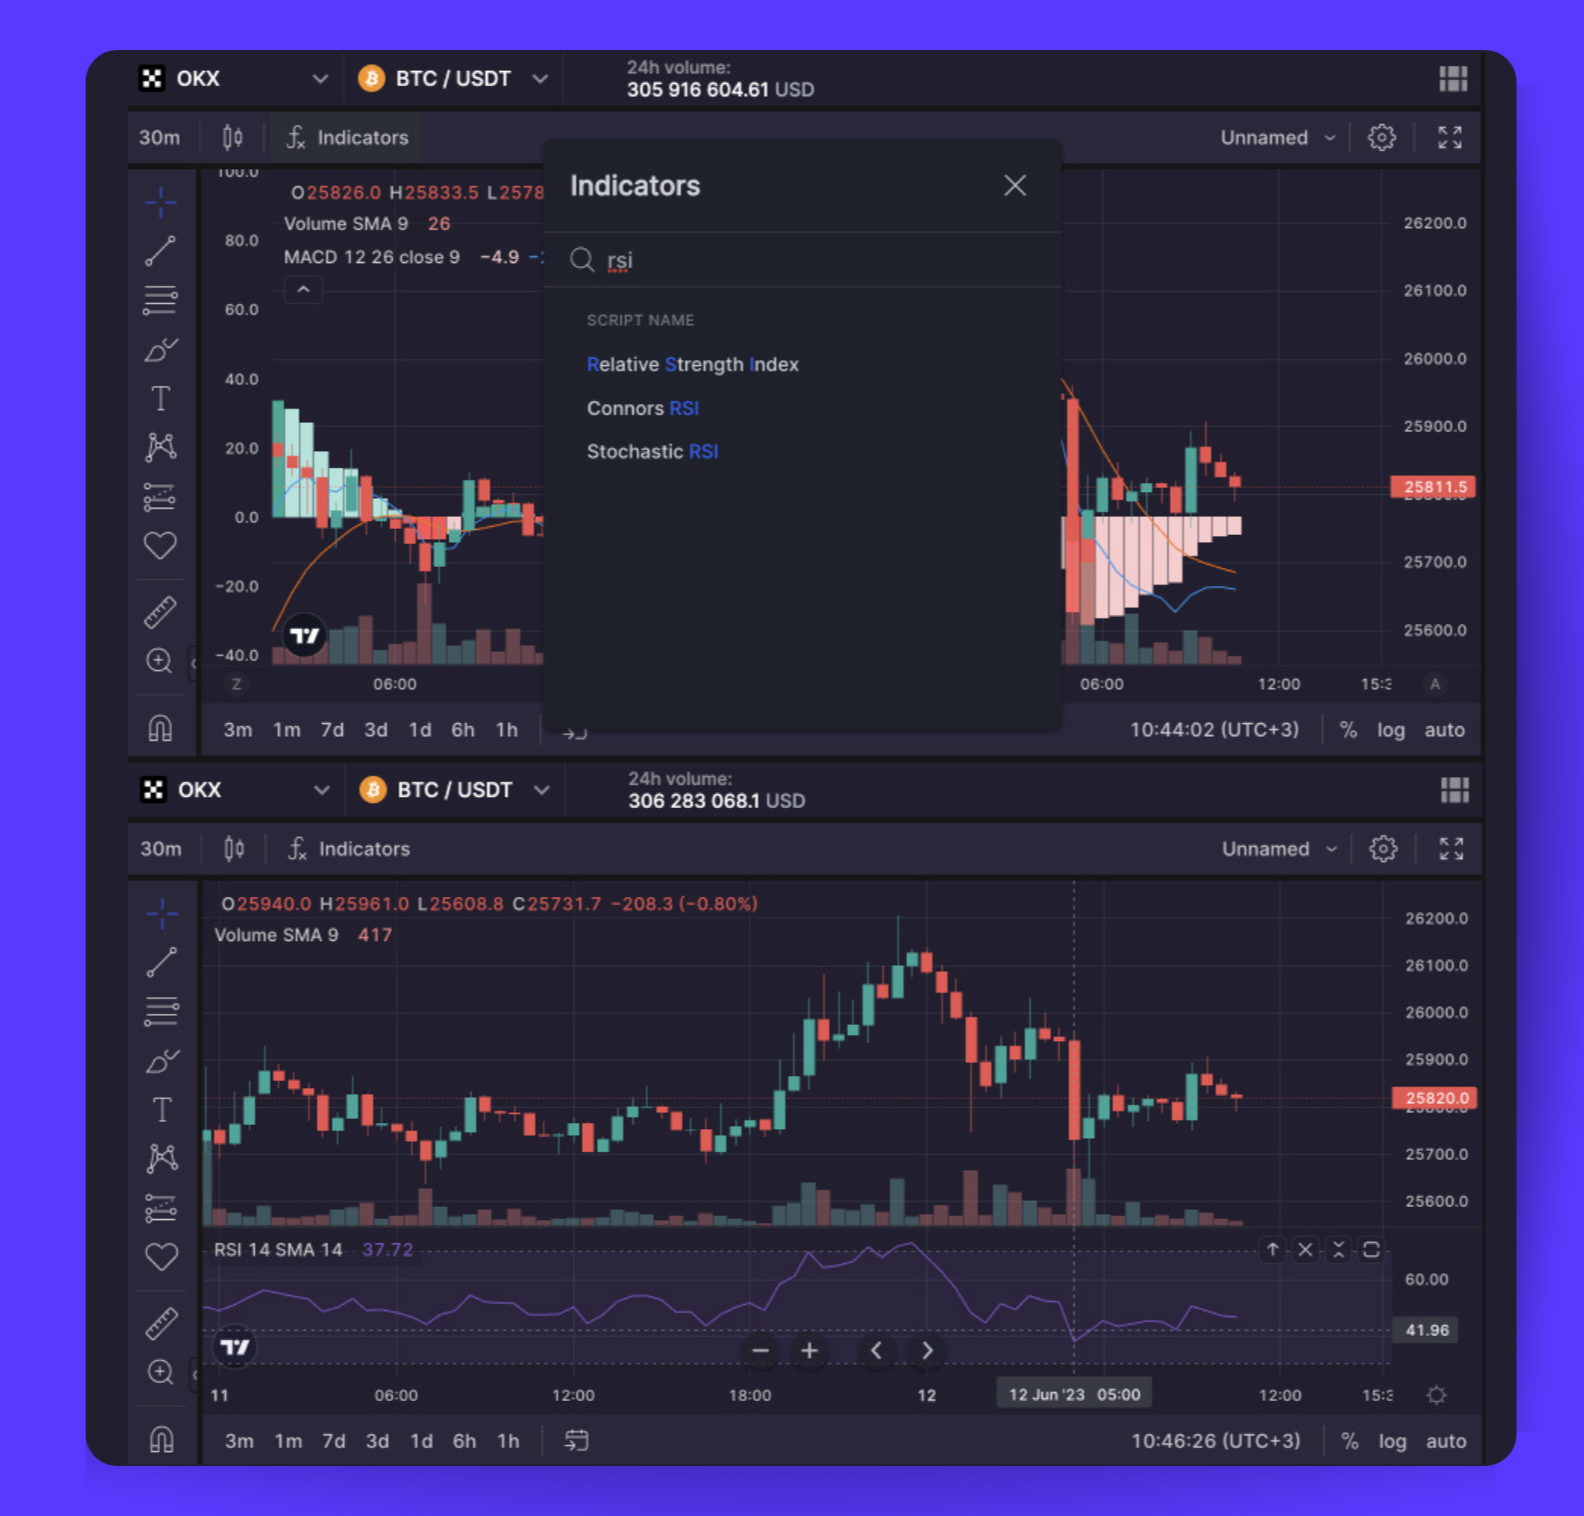
To apply an RSI indicator to your chart, simply go to the [Trading] tab on Bitsgap, choose your exchange and trading pair, click on the [Indicators] tab, and select RSI from the list. This will display an RSI line graph beneath your market chart (Pic. 1):
Tips on setting RSI indicator
As with any technical indicator, RSI can be tailored to a specific instrument. The only adjustable parameter in the formula is the averaging period duration. Typically, RSI is used with a 14-day adjustment. Lengthening the averaging period reduces false signals but may decrease the efficiency of profitable trades due to signal lag.
For opening trading positions, such as buying assets, the level 50 crossing signal is more effective when the indicator is adjusted to a longer range, like 21 days. Divergence and the indicator's return from oversold or overbought zones are suggested for partially closing positions, such as selling assets. To make the indicator more sensitive, reduce the averaging period to eight or nine days.
Understanding RSI in crypto: RSI Indicator Example
Jimmy has been keeping an eye on a specific coin but is reluctant to purchase it due to its high price. He regularly monitors the RSI, which suggests the asset is overbought and its price inflated. So he bides his time, hoping to snag it later at a lower price.
Soon enough, the asset's price starts to drop, as Jimmy anticipated. However, he's uncertain whether it has reached its lowest point, so he continues to track the RSI. As the RSI dips below 30, Jimmy determines that it's the perfect moment to act.
Having acquired his new cryptocurrency, he patiently holds onto it. Within months, the price stabilizes at a market-supported level, and Jimmy is already enjoying a profit on his investment — all thanks to RSI's ability to identify over- or undervalued assets.
👉 So, here’s the moral of the story: RSI helps you discern overarching market trends. The most basic application of the index involves purchasing an asset or cryptocurrency when it's oversold and offloading it when it's overbought.
Crypto RSI strategy: When and How to Use RSI in Crypto
The RSI indicator provides multiple buy or sell signals, which can be categorized as follows:
RSI Divergence
A key trading signal is the divergence (Pic. 2) between an asset's price and the RSI chart.
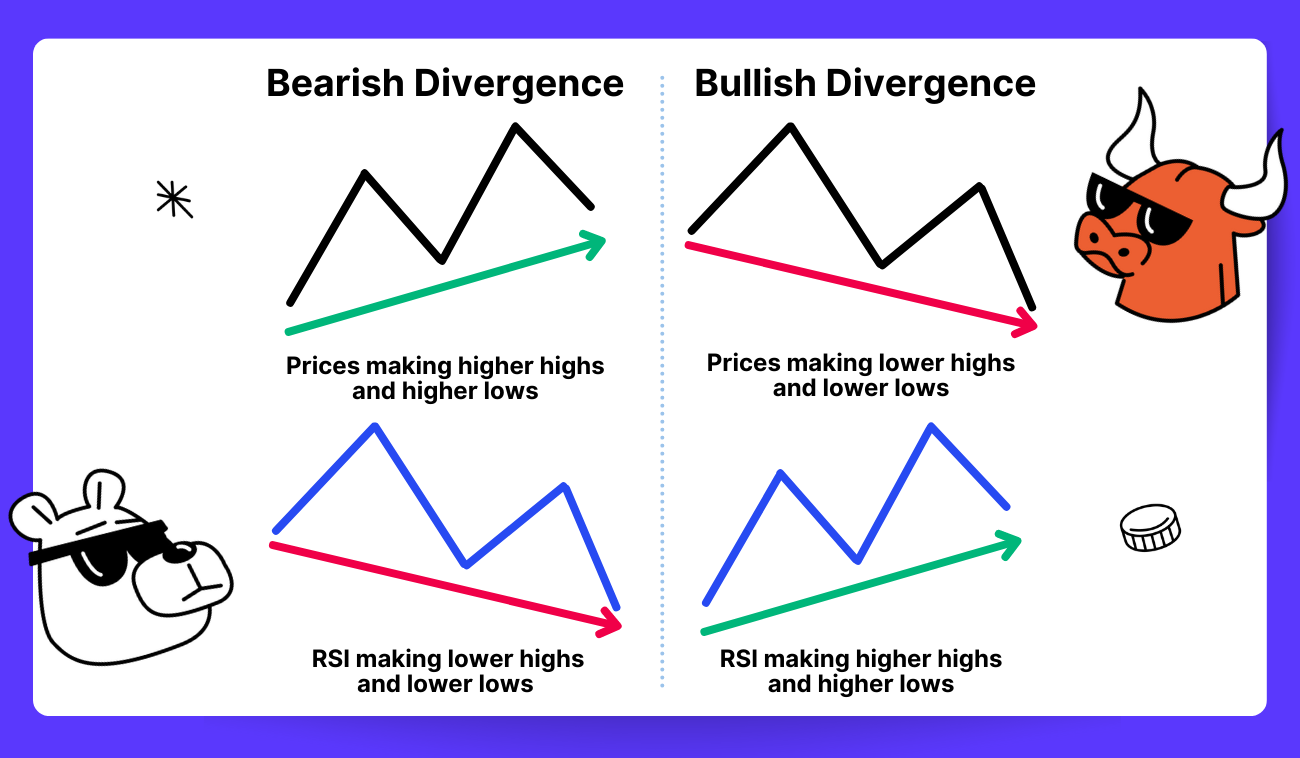
Divergence occurs when the asset's price reaches new highs or lows while the RSI value is lower or higher compared to previous levels. For instance, bearish divergence arises when the price breaks records but the oscillator's value is lower than the previous high, signaling a potential shift from an upward to a downward price trend.
Bullish divergence transpires when the price hits a new low and the RSI surpasses its previous low, suggesting a price reversal from downward to upward.
However, it is important to note that a divergence merely indicates the possibility of a trend reversal; it does not definitively confirm it. The price trend needs to actually reverse direction for a divergence signal to be valid.
👉 To illustrate how divergence works, imagine you are blowing up a balloon. As you inflate the balloon, its size increases with each breath (like the price of an asset rising). However, the rate at which the balloon expands starts to slow down (like the RSI indicator failing to reach a new high). Even though the balloon is still inflating overall, the reduced rate of expansion could indicate it is nearing maximum size and about to burst (like the price trend potentially reversing).
Overbought and oversold
Conventional wisdom suggests an RSI reading over 70 indicates an asset is overbought, while under 30 is oversold (Pic. 3).
👉 In other words, some believe an asset is considered too expensive when RSI exceeds 70, signaling it may soon decline, or too cheap when under 30, signaling it may soon rise.
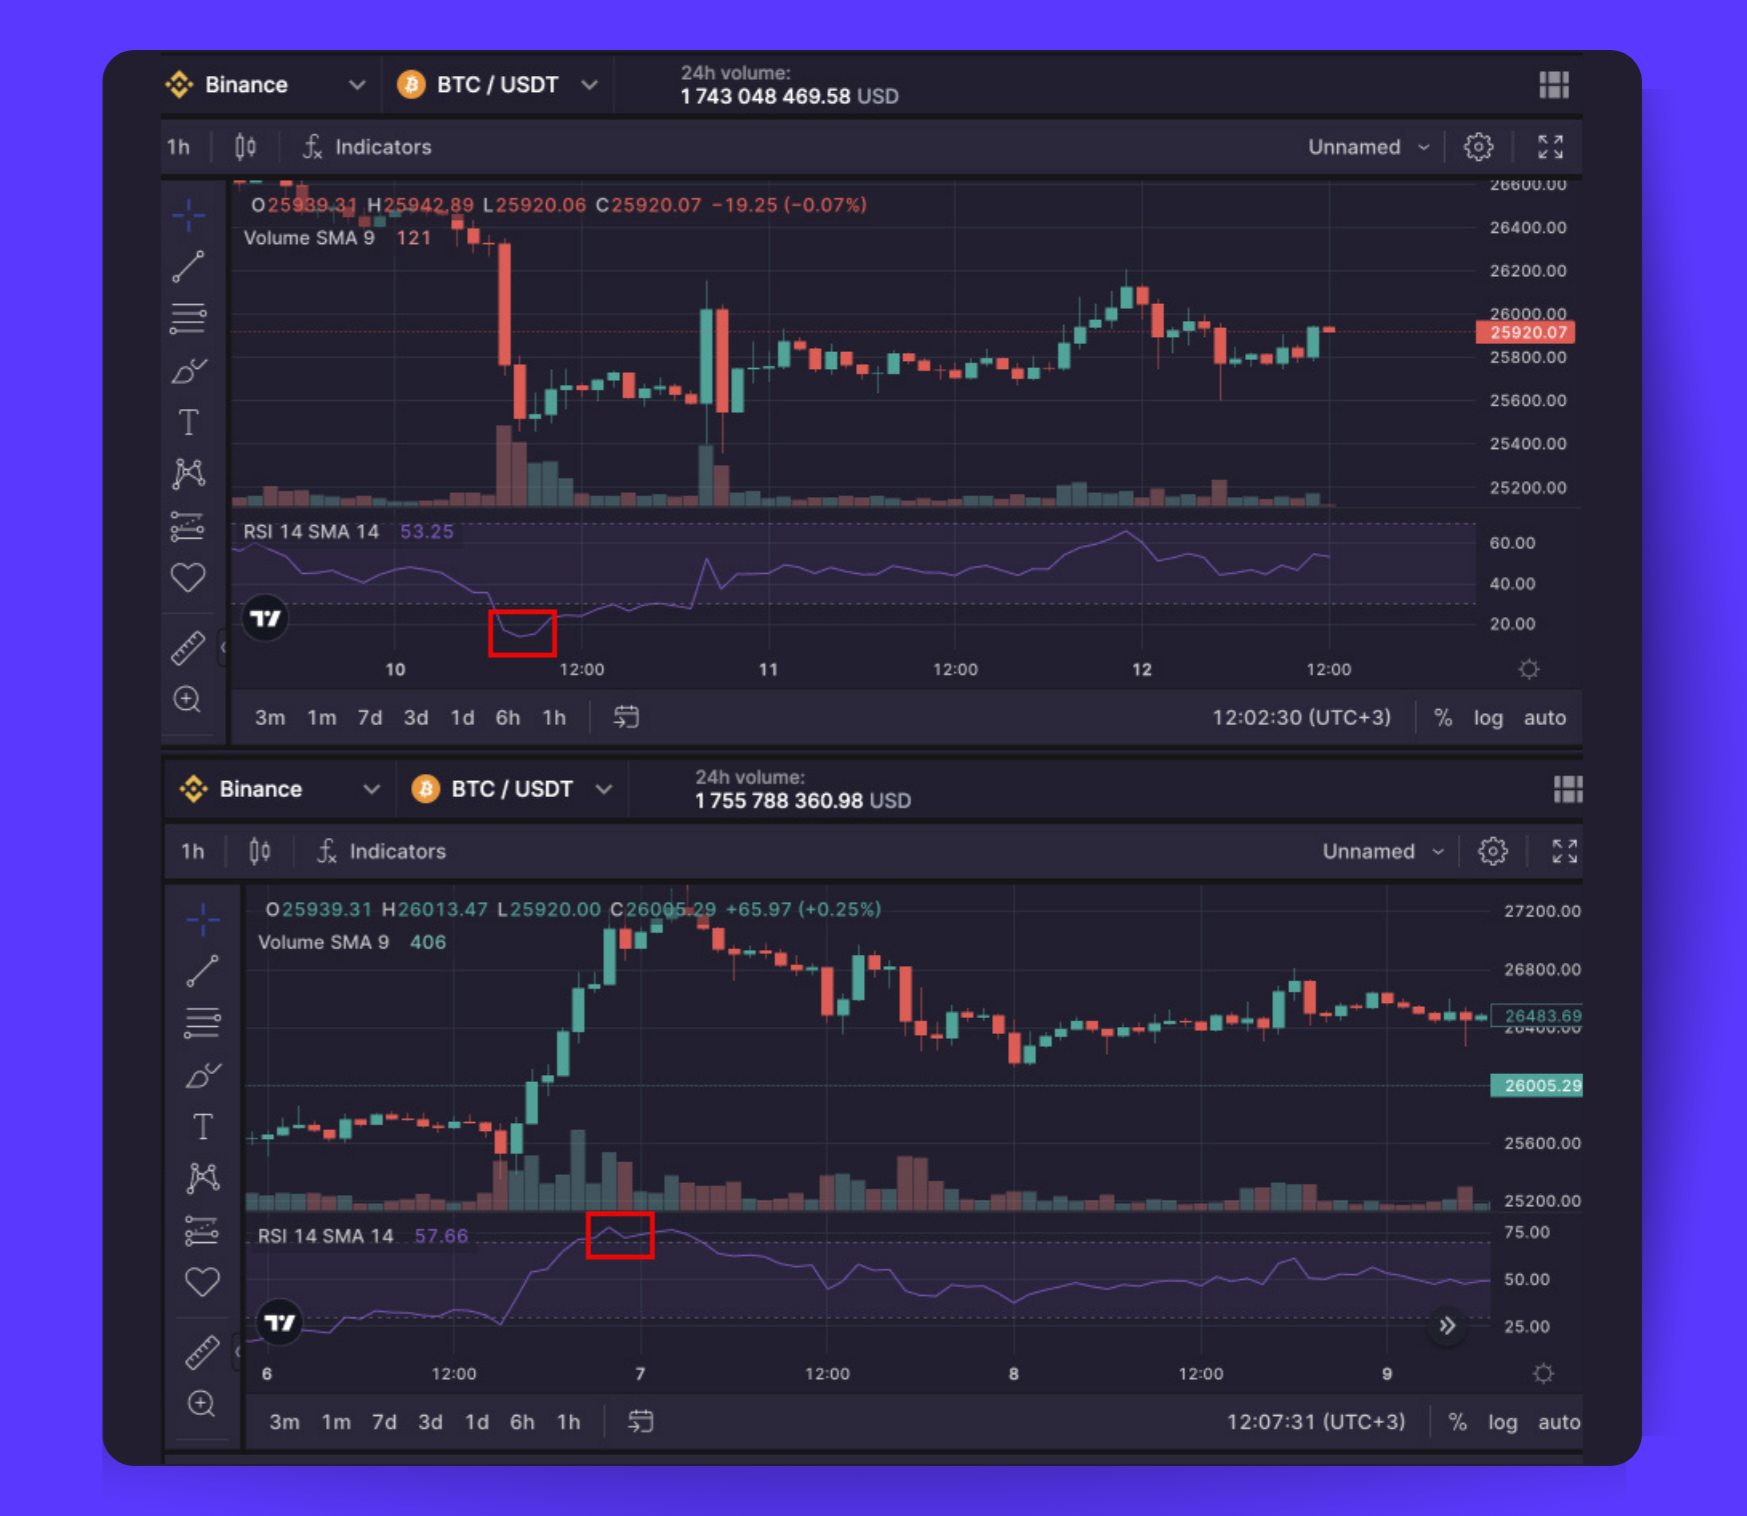
However, the RSI formula actually only measures the strength of recent price changes, not whether a reversal is imminent. The 70 and 30 thresholds are arbitrary and the true overbought and oversold levels depend on the historical price fluctuations of each asset. The actual overbought and oversold zones could fall outside the 30 to 70 range.
👉 While an asset may appear overextended based on RSI, this alone does not necessarily foreshadow an immediate trend reversal. RSI only indicates the momentum of recent price movement, not a guaranteed change in direction. Price trends often continue for some time before ultimately reversing.
However, when RSI does exceed its normal upper or lower levels but then returns within those boundaries, it can signal a potential trend reversal. For instance, if an asset's RSI typically oscillates between 30 and 50, a drop below 30 into oversold territory then a move back above 30 could signify a bullish reversal. Similarly, RSI rising above its normal overbought threshold and then falling back within its range could signal a bearish reversal.
In summary, while an overheated or overchilled RSI level suggests a tit-for-tat trend reversal could soon transpire, it does not confirm its fruition. RSI measures vigor and impulse but cannot vouchsafe a vouched-for change in trend direction. Only when RSI enters extreme territory and then reverses back into its normal range does it provide a higher probability signal of a potential trend shift. But price action ultimately determines when and if a reversal comes through.
RSI 50 Crossing
The RSI crossing the 50 level (Pic. 4) indicates a shift in price momentum, hinting at a possible new trend. An upward cross suggests bullish momentum is gaining strength, while a downward cross implies bearish momentum is dominant. However, RSI 50 crossovers aren't foolproof signals for trend reversals, as price trends can persist even after momentum indicators suggest change.
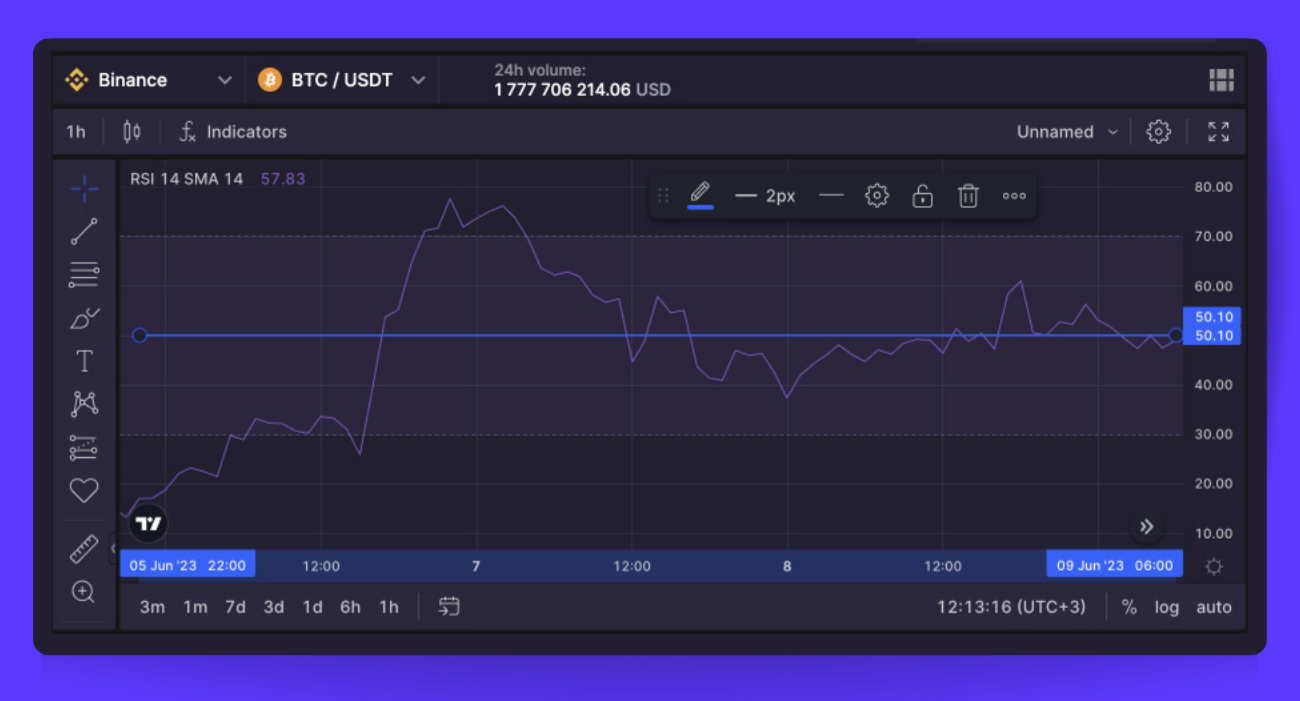
In essence, the RSI 50 level represents a balance between bullish and bearish forces. As price fluctuations accelerate, RSI crosses this midpoint, reflecting the prevailing momentum. The crossover is a lagging confirmation, not a prediction, and the actual emergence of a new trend depends on price action follow-through.
RSI Advantages and Disadvantages
Understanding the advantages and drawbacks of the RSI indicator is crucial before applying it in trading.
Advantages:
- Versatility: RSI can gauge both strength and weakness in any market or timeframe. It shows if a market is gaining or losing momentum, which can signal how far a trend may run or when a reversal may come.
- Accessibility: RSI is a popular indicator offered on all trading platforms.
- Easy to set up: RSI is simple to apply and does not require advanced trading knowledge. Traders can easily find and add RSI to any chart.
- Flexibility: RSI can be used alone or along with other indicators for deeper analysis. It is a useful tool all traders should employ as part of their trading strategy.
Disadvantages:
The most significant drawback of RSI is its lagging nature, which can result in false signals, especially on lower timeframes. During high volatility, the indicator may remain in overbought or oversold zones, leading to inaccurate information and potential losses. As a result, the RSI is most effective in oscillating markets (trading ranges) where asset prices alternate between bullish and bearish movements.
In short, as with other indicators, RSI should not be used as a stand-alone indicator — rather, its signals should be considered in the context of other technical and price analyses for the most well-informed trading decisions.
What Is Stochastic RSI Indicator?
The Stochastic RSI (StochRSI) is a cousin indicator of the RSI, developed to create more sensitivity and yield an extra signal. Crafted by Chande and Kroll to reap the benefits of momentum measures while factoring in an asset’s unique DNA, StochRSI applies the stochastic formula to RSI values. Rather than a generalized gauge of price shifts, it's tailored to an asset’s grant-backer's past performance, churning out more signals than long-established indicators alone.
Much in the same fashion as classic RSI, StochRSI tries to evaluate if an asset is overbought or oversold. Under 0.20? The asset is clearly oversold, suggestion RSI is trading at the cheap end of its ambit and the short-term tendency may be bottoming before an surgent rise. Conversely, over 0.80 implies RSI could be apex steeping and the underlying asset is prone to retreat.
In addition to identifying overbought/oversold conditions, StochRSI can detect short-term trends by considering it as an oscillator with a 0.50 centerline. When StochRSI is above 0.50, the asset may be trending higher, and vice versa when below 0.50.
However, because StochRSI can yield too many signals, it should be combined with other technical indicators or price patterns to maximize effectiveness. On its own, the surfeit of signals can prove misleading. So use it cautiously and give it further context.
Bottom Line
The RSI is a crypto trader's secret weapon for gauging momentum. When prices oscillate, the RSI sings — but beware, for when crypto rockets to the moon, the RSI may lead you to overbuy or panic sell.
This handy indicator measures push and pull, signaling when an asset may be ripe for reversal. Yet the RSI alone cannot foresee crypto's whims, as markets move fast and indicators lag behind.
So wield this weapon wisely and never go all in based on RSI's call. Look to charts, news, instincts too, for trading crypto demands a strategy as dynamic as the assets themselves.
FAQs
How Is RSI Calculated?
RSI is determined using a mathematical formula that compares the average gain and loss over a specific time frame. Typically, 14 periods are used as a benchmark for assessing an asset's true value.
The resulting numerical scale indicates the value of a coin or token, with values above 70 considered overbought and values below 30 deemed oversold. This allows investors to determine which coins or tokens are worth trading.
Thankfully, you don't need to fully understand the underlying mechanics to use RSI effectively. Most reliable trading platforms (like Bitsgap) come equipped with an RSI indicator, allowing you to leverage the numerical scale for your trades.
How Reliable Is RSI Indicator?
Numerous crypto traders appreciate the RSI indicator for its straightforwardness and dependability. However, investors should remember that all indicators are derived from historical market data. Many of these indicators, while helpful, cannot account for extraordinary market activity, which can be a common occurrence in the cryptocurrency space.
Avoid relying solely on any single trade and aim to use multiple indicators or signals to inform your decisions. Nevertheless, RSI serves as an excellent starting point for those unfamiliar with crypto trading signals, as it is simple to begin using.