Check Market Sentiment with Crypto Fear vs. Greed Index
The Fear and Greed Index can help you leverage trading opportunities based on prevalent market sentiment. Interested? Let's dive into it.
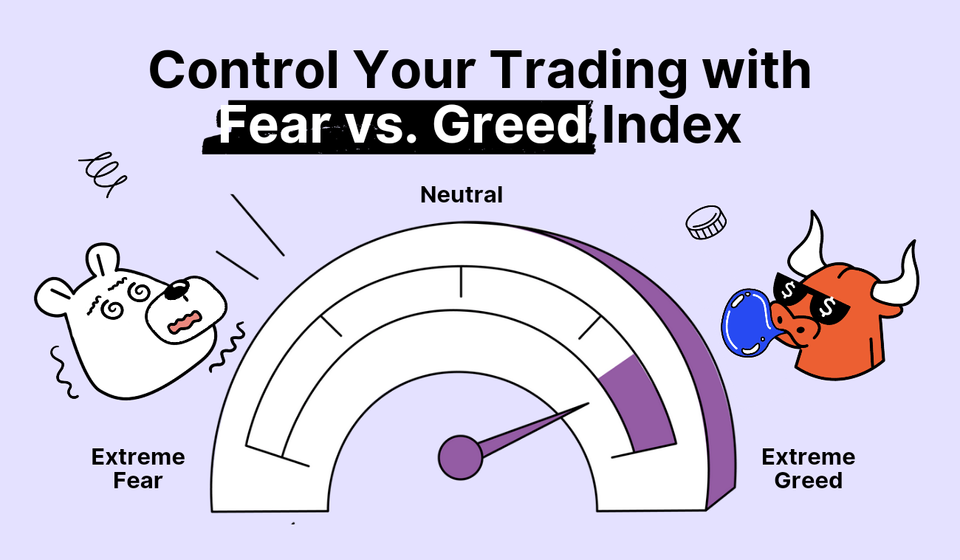
Since all our actions are driven by emotions, it’s worth having extra tools to control them in your favor. One such tool is the Fear vs. Greed Index. It gauges market sentiment and helps you time the market. Learn what the Fear and Greed Index is and how to use it in crypto.
Ever noticed that your FOMO or FUD was responsible for your trading behavior? Well, we’ve all been there: bought quickly when markets turned green and sold off seeing red numbers.
The question is — how to save yourself from emotional overreactions?
The answer is pretty obvious — thorough fundamental and technical analyses, technical indicators, and indices.
One such index — Fear and Greed — evaluates the market sentiment to help you make more informed decisions. Historical analysis confirms that the Fear and Greed index can be a useful and reliable indicator for leveraging trading opportunities. And as such, it’s worth examining closely. So, let’s get started.
What Is Stock Market Fear and Greed Index?
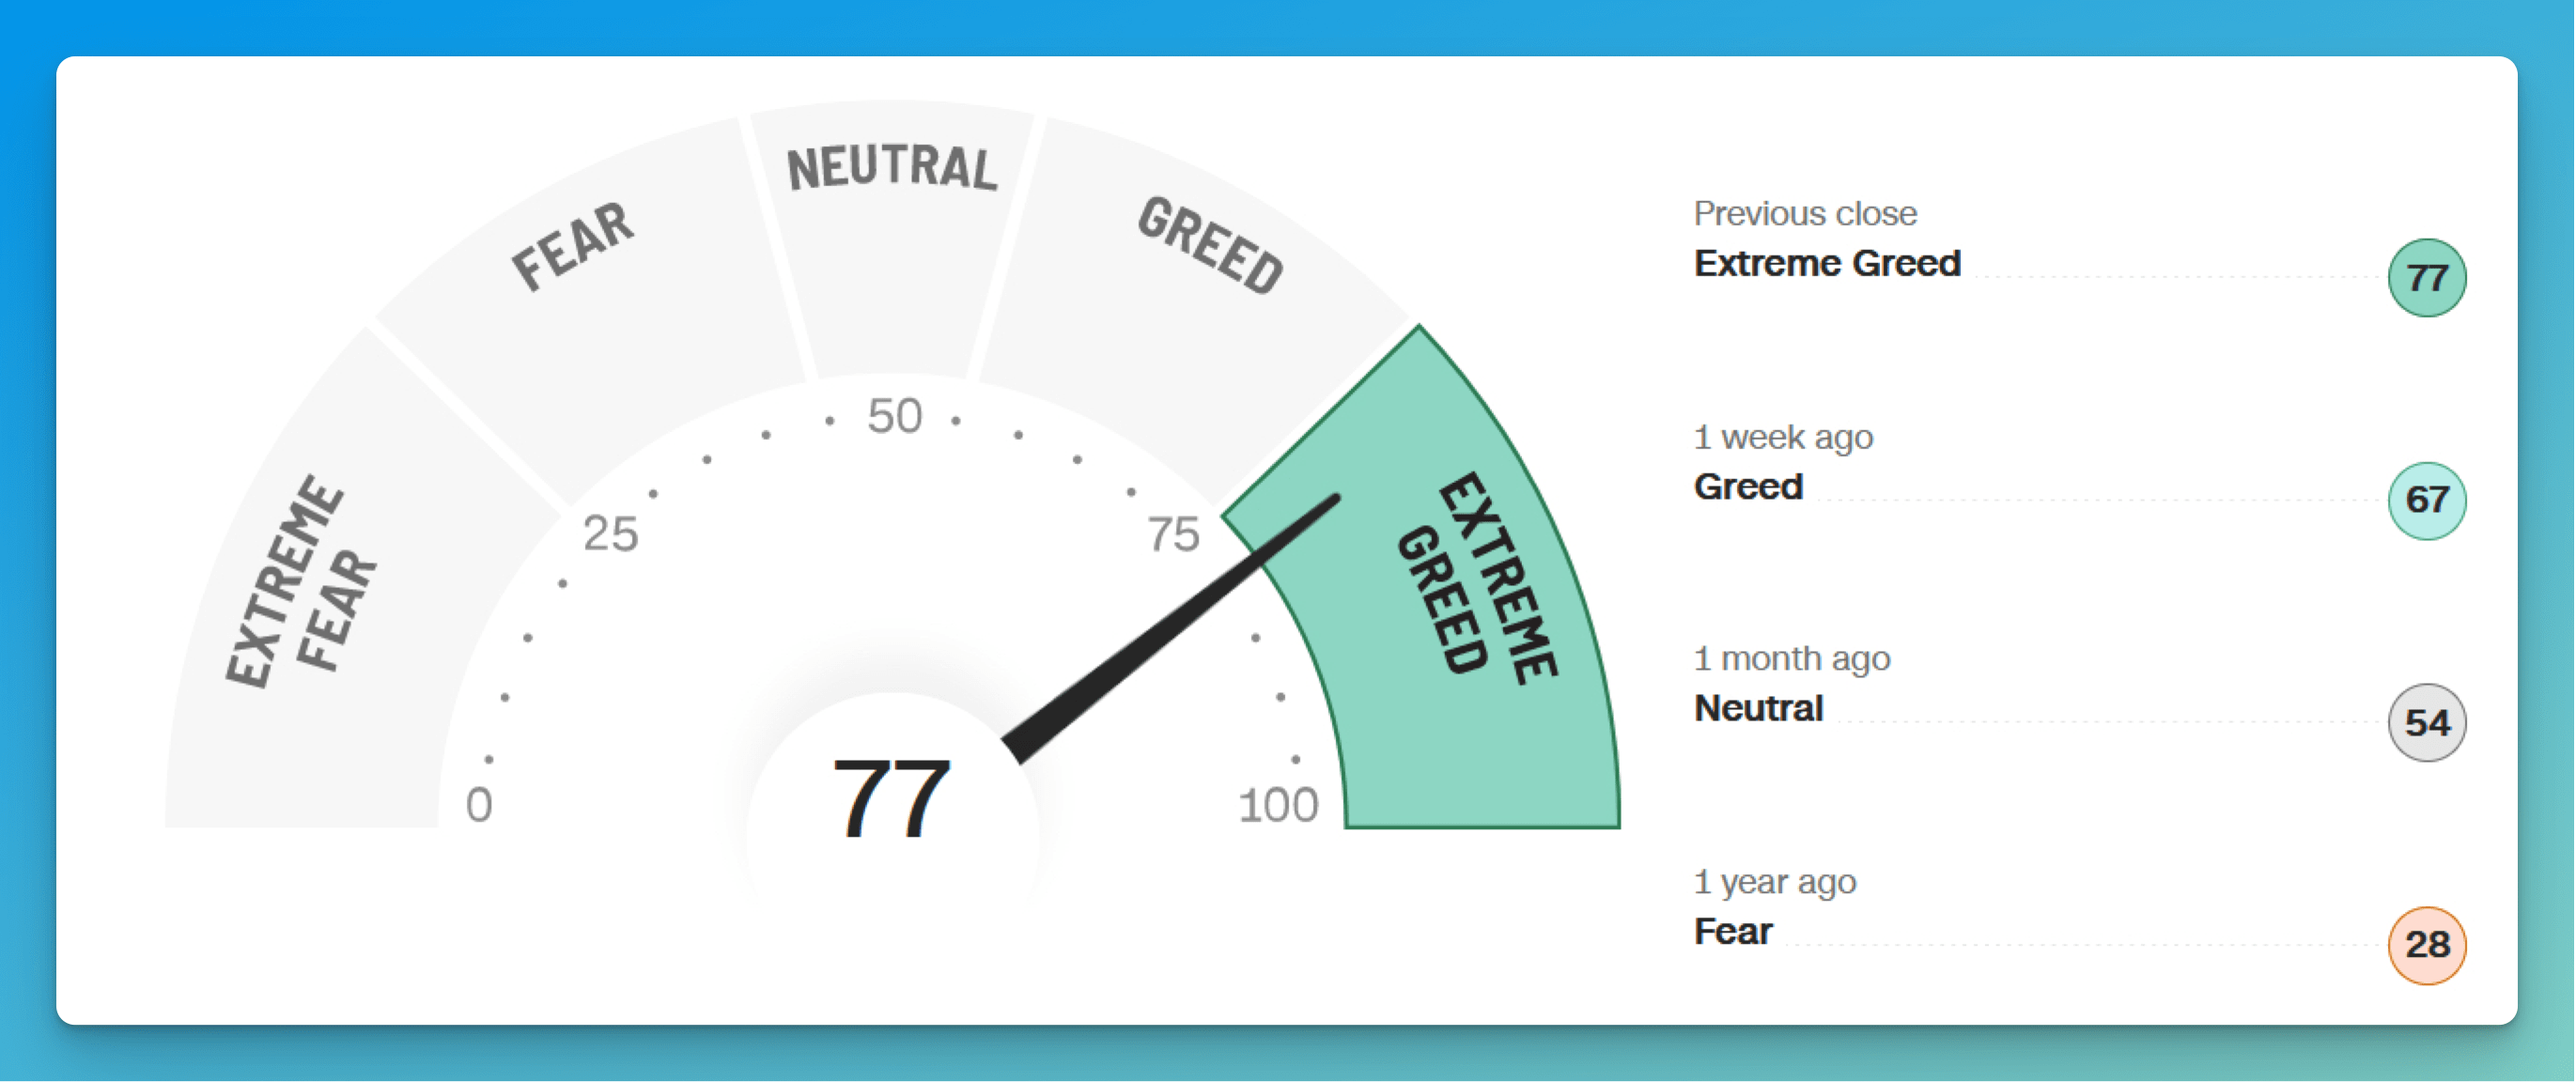
The stock market Fear and Greed Index (Pic. 1) was developed by CNNMoney to track and gauge the intensity of two key sentiments that affect stock market prices. Based on the assumption that fear tends to push down prices while greed has the reverse effect, the index can be used to determine if markets are fairly priced.
This way, unreasonable fear can result in stocks trading below their real value and, as such, represent a buying opportunity. At the same time, rampant greed can lead to stocks trading way above their fair price.
👉 Since the index promotes market timing, it’s often dismissed by the proponents of a buy-and-hold strategy. However, not everyone prefers to hold on to assets long, so the Fear vs. Greed Index continues to be a valuable tool in traders’ arsenals.
How Is Stock Market Fear and Greed Index Calculated?
Before we get down to the crypto Fear and Greed index, it’s important to understand how the traditional index is calculated.
To determine how much fear or greed is in the market, CNNMoney tracks and examines seven key indicators:
Stock Price Momentum
A measure of the S&P 500 vs. its 125-day moving average (MA).
It’s always useful to compare current stock market levels to their historical highs and lows. There’s a sign of positive momentum when the S&P 500 is trading above its moving average of the previous 125 days. Conversely, if it falls below the average, traders are getting nervous. The Fear and Greed Index looks for signs of sluggish momentum for fear and increasing momentum for greed.
Stock Price Strength
The number of stocks at the NYSE at 52-week highs vs. 52-week lows.
It’s important to know how many stocks are doing well compared to those that have seen better days. The Stock Price Strength index shows the number of stocks that are hitting 52-week highs versus those hitting 52-week lows. When there are more highs than lows, it signals greed.
Stock Price Breadth
A trading volume in both rising and falling stocks.
The metric examines the volume and quantity of rising shares on the NYSE compared to those that are falling. Low (or negative) numbers and a decreasing volume are all bearish signs and indicators of fear.
Put and Call Options
The number of put vs. call options.
When the ratio of put (sell) options is rising, it’s a sign that investors are getting skittish. The Fear and Greed Index takes it as a sign of fear.
Junk Bond Demand
The spread between yields on investment-grade bonds and junk bonds.
Since junk bonds carry a higher risk of default than other bonds, demand for those bonds is a clear indication of greed. Yields rise when people are selling and drop when people buy. So a smaller spread between junk and safer bonds is a sign that investors are taking more risk.
Market Volatility
The CBOE Volatility Index (VIX) for a 50-day MA.
The VIX measures volatility in the S&P 500 Index options over the next 30 days. It frequently falls on days when the overall market rises and jumps when the stock prices fall. However, it’s crucial to monitor the VIX over time. Increasing market volatility is a sign of fear.
Safe Haven Demand
The returns for stocks vs. treasuries.
Safe Haven demand shows the difference between the treasury bond and stock returns over the past 20 days. Since stocks are riskier than bonds, bonds tend to do better when investors are scared. The Fear and Greed Index uses increasing safe-haven demand as a sign of fear.
👉The Fear and Greed Index is calculated by taking an equal-weighted average of each of those seven indicators, which are measured on a scale from 0 to 100. The index is calculated on a daily, weekly, monthly, and annual basis. A reading of 50 deems neutral, anything below signals fear and higher — greed.
What Is Fear and Greed Index Crypto?
Seeing the success and usefulness of the Fear and Greed Index for the stock market, the team behind alternative.me has come up with a similar indicator (Pic. 2) for the cryptocurrency market. Every day, the team analyzes prevailing market sentiments based on different online sources to calculate the Fear and Greed Index for Bitcoin and large altcoins.
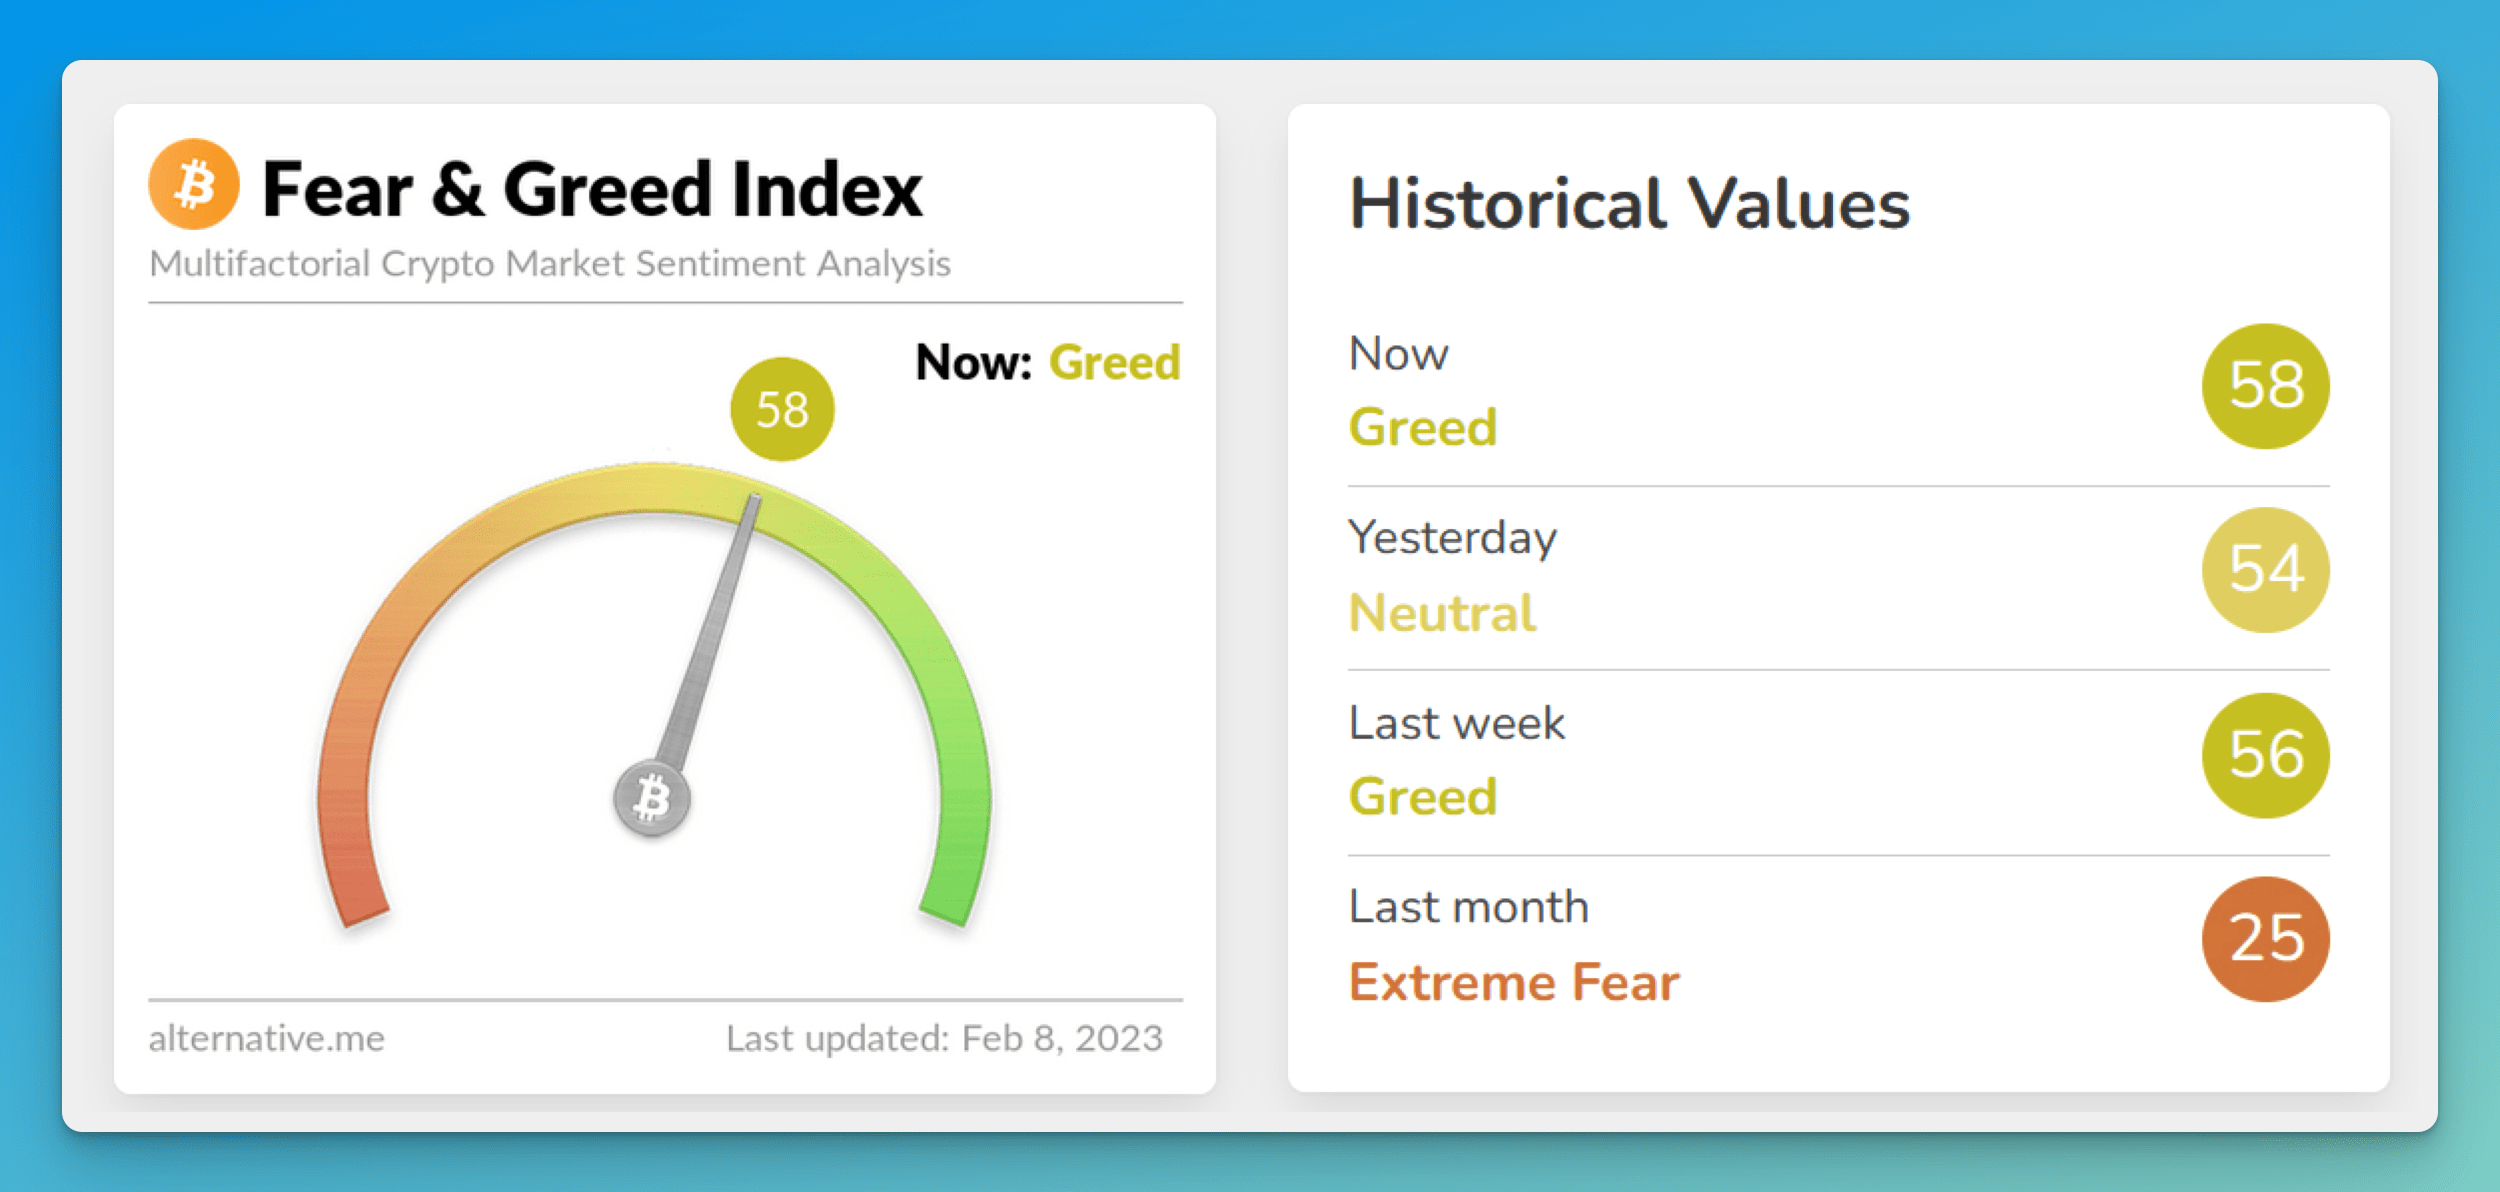
Similar to the CNNMoney indicator, the Crypto Fear vs. Greed Index shows a value of 0 or extreme fear when investors are worried and a value of 100 or extreme greed when the market is heading for a correction.
How Is Greed/Fear Index Crypto Calculated?
Alternative.me uses the following six inputs to calculate the Greed Fear Index Crypto:
- Price volatility over the past 30 and 90 days (25%)
The input estimates current market volatility and compares it with the corresponding averages of the last 30 and 90 days. The higher the volatility, the more fear there is in the market.
- Market volume and momentum (25%)
The input measures the current market volume and momentum with the corresponding averages of 30 and 90 days. When buying volumes are consistently high, the market is bullish.
- Social media mentions on Twitter (15%)
The input currently tracks only the Twitter sentiment, but a similar tracking algorithm for Reddit is in the works. The Twitter sentiment gathers and counts hashtags with particular keywords and interactions within the community. A high public interest corresponds to greedier market behavior.
- Surveys of crypto community members (15%)
Even though the story goes that the surveys have been put on hold, Alternative.me, together with strawpall.com (which they own), used to conduct weekly polls among around 2-3k traders to gauge their market sentiment.
- Bitcoin market cap dominance (10%)
Since Bitcoin becomes a sort of ‘safe haven’ for crypto, the rise in its dominance signals a growing fear of speculative altcoin investments. Conversely, if Bitcoin’s dominance diminishes, people are getting more greedy by investing in risky coins. At the same time, if we measure a particular altcoin market cap, the effect is the opposite — a rising market cap of that altcoin signifies investors’ interest and their bullish behavior.
- Google trends data (10%)
The Alternative.me team pulls and analyzes Google trends data, including search queries and volumes for popular searches. Based on that data, the team comes up with a market sentiment estimate.
Pros and Cons of Fear vs. Greed Index
While there’s no scientifically proven research on the biochemical effects of greed vs. fear, it’s generally accepted that those two emotions are powerful motivators when it comes to money.
Behavioral economists agree — there are decades worth of evidence of the effect of both fear and greed on investment decisions. Therefore, keeping an eye on the Fear and Greed index makes sense, particularly because it’s not just one indicator but comprises several inputs that compare plenty of data.
Skeptics, however, downplay the importance of the Fear and Greed Index, discrediting its value as sub-par. Instead, they argue that for the buy-and-hold strategy, which they advocate as generating the greatest returns, the Fear and Greed Index produces nothing but noise.
👉 However, there are still many investors who capitalize on market volatility and watch such indicators as Fear and Greed very closely. After all, the Fear and Greed Index produces powerful signals and can be used along with other indicators to make better trading decisions.
Bitsgap’s Market Sentiment Index — Technicals Widget
Although Bitsgap doesn’t have an in-built Fear and Greed tool, the platform has something very similar — the Technicals Widget. Arguably, even better than the good old F&G Index.
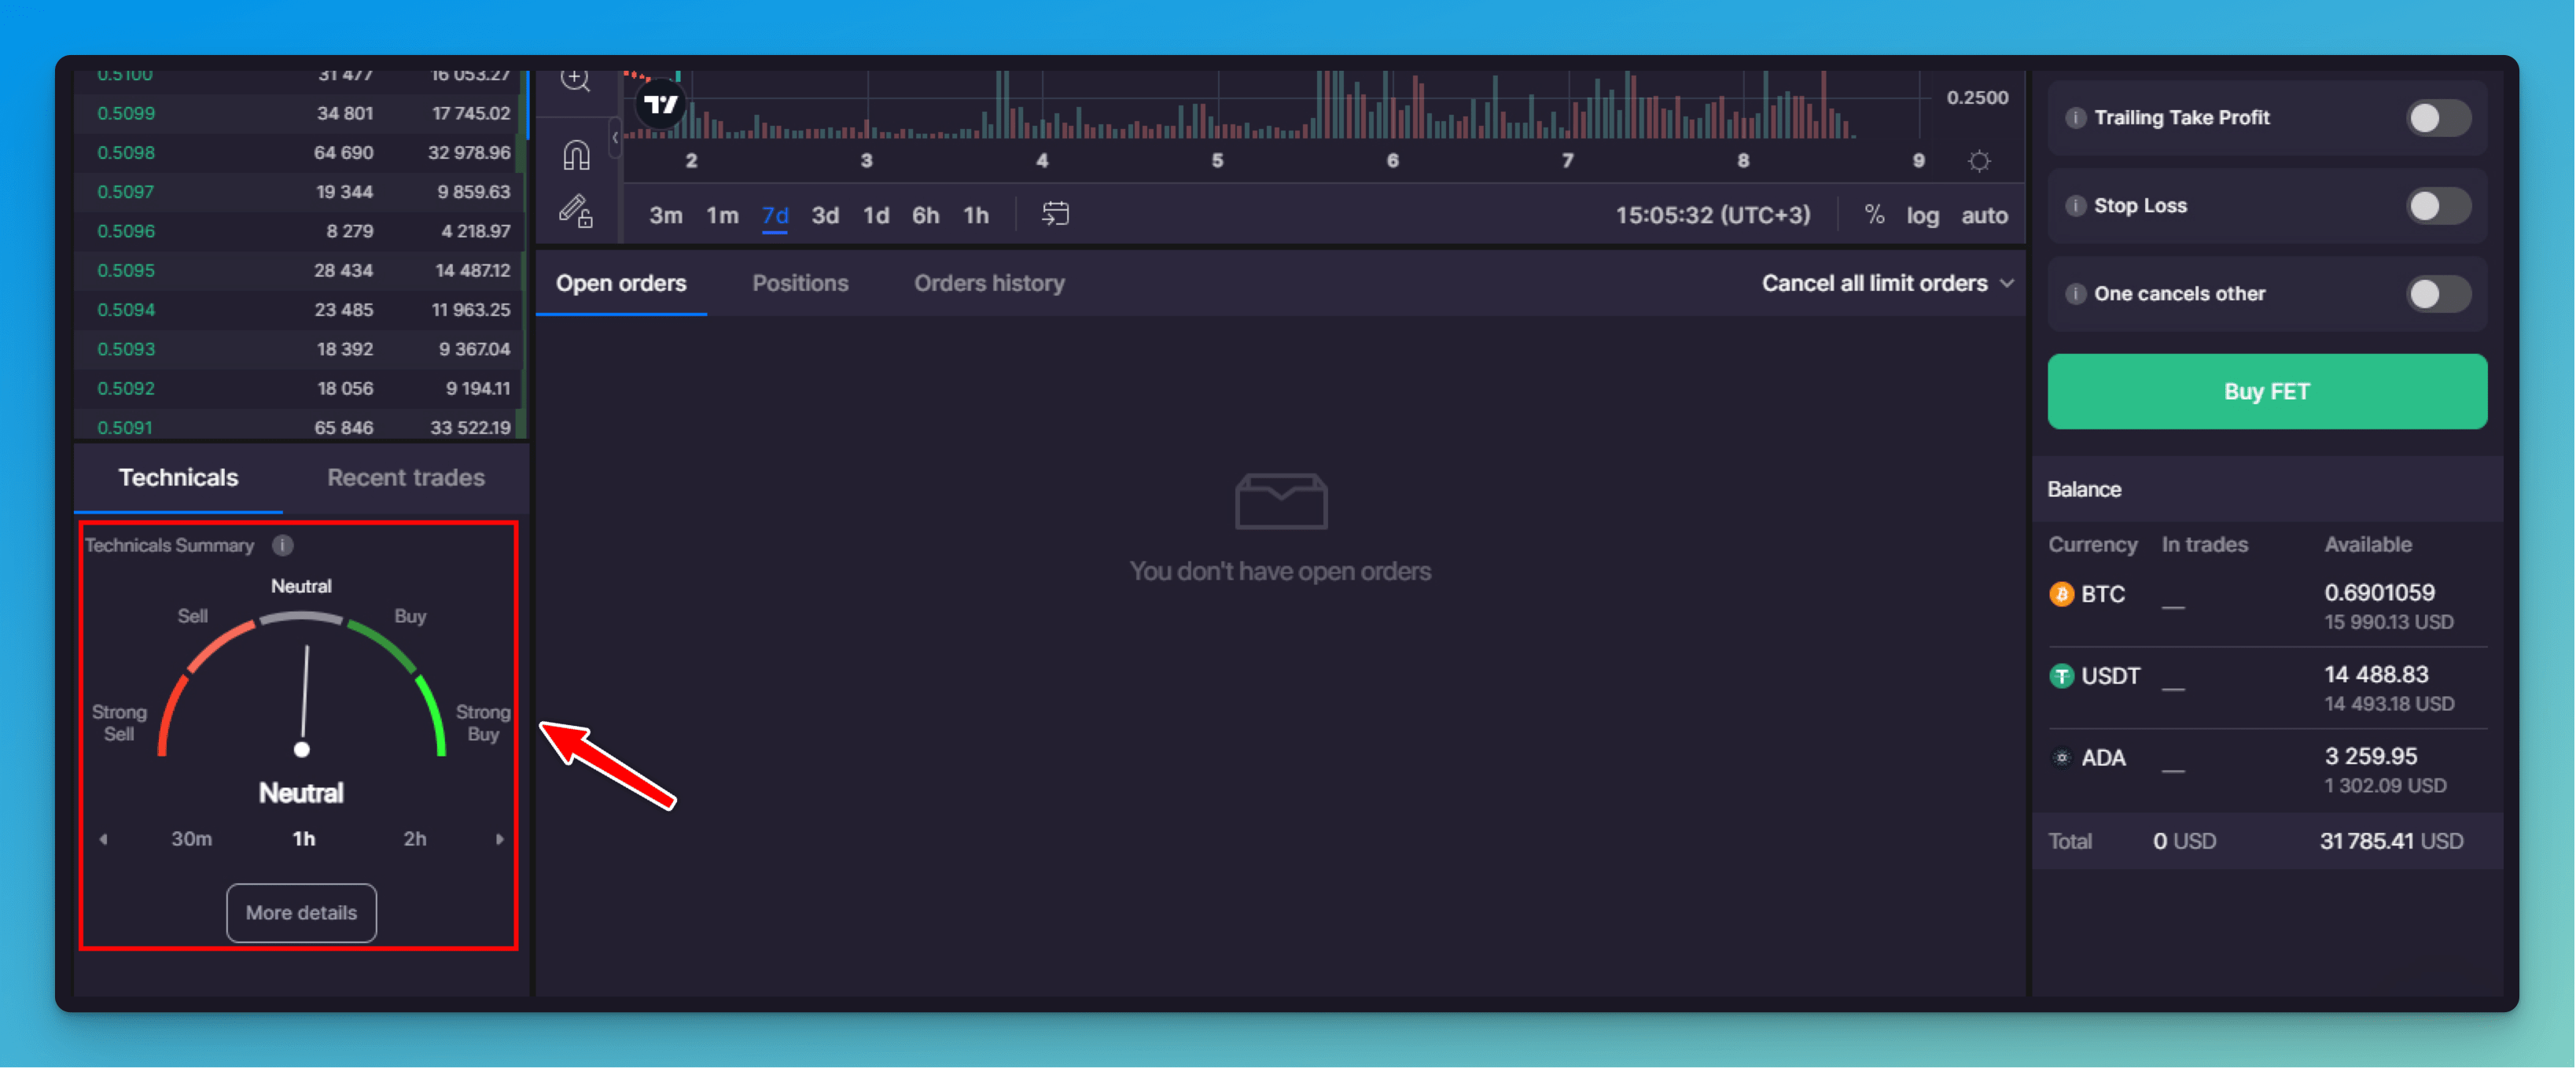
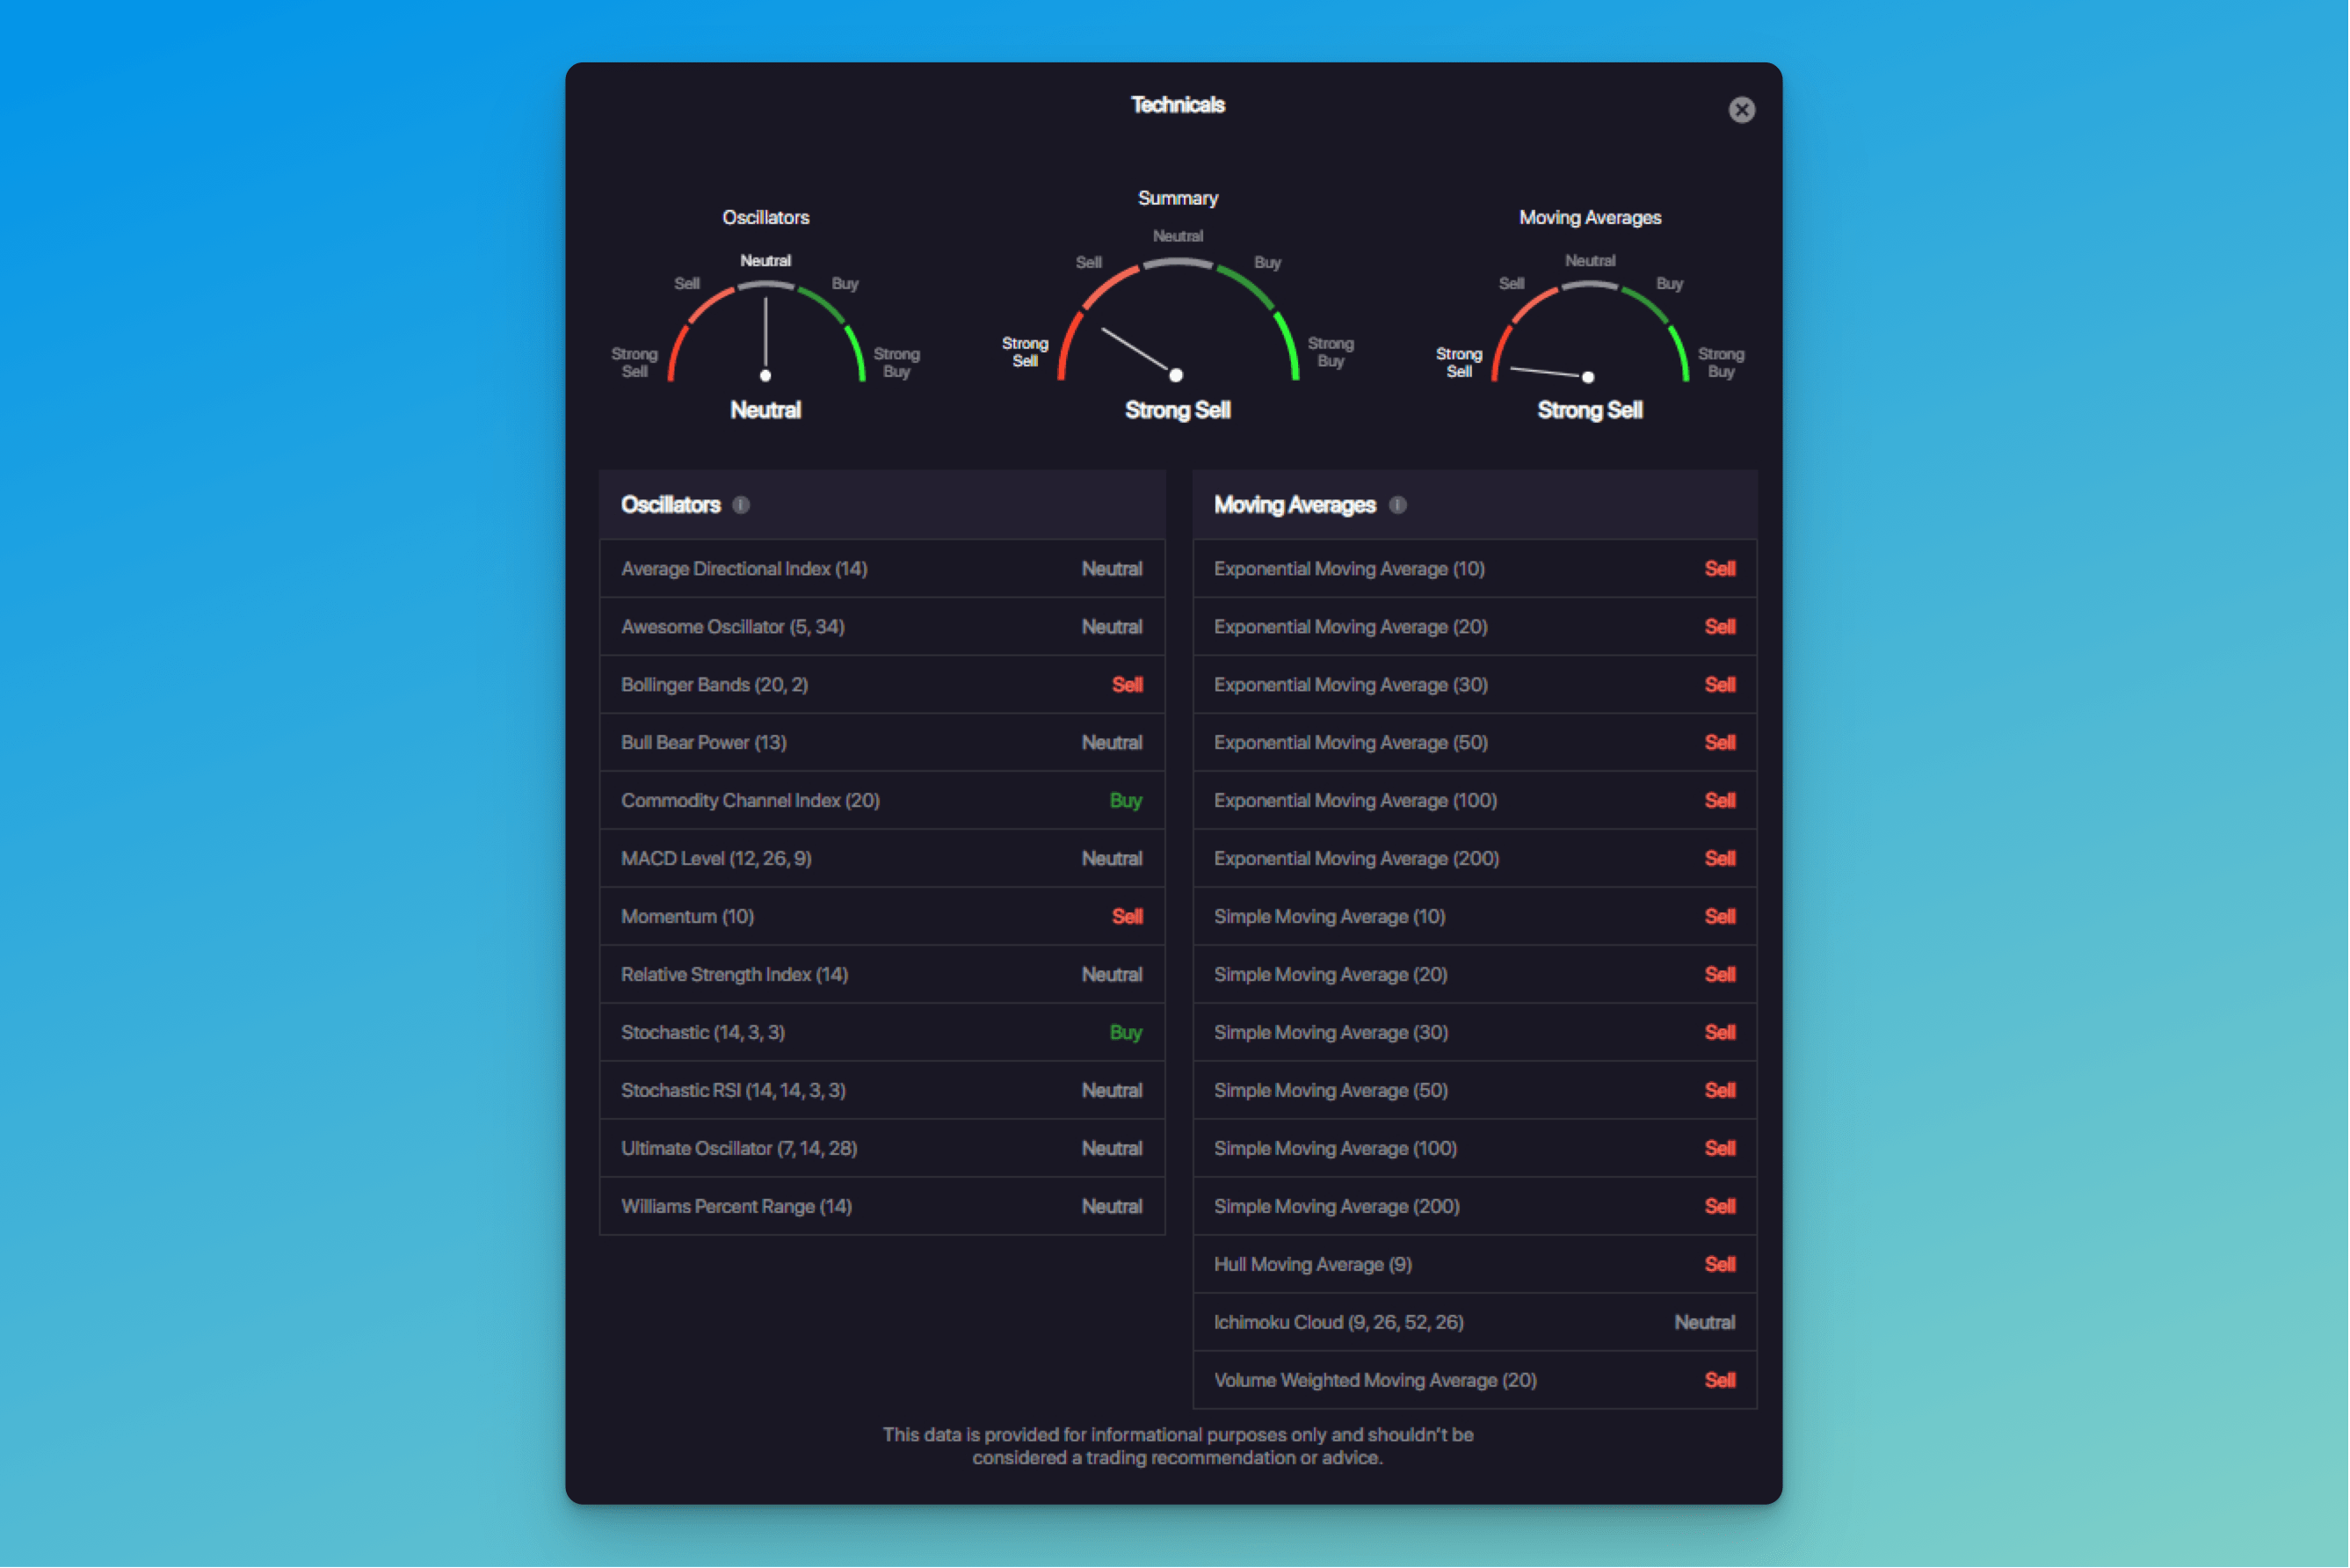
👉 The Technicals widget combines and averages signals of multiple indicators to produce just one overall signal — buy (strong buy), sell (strong sell), and neutral.
Currently, the widget watches over 27 indicators, among which are: Bollinger Bands (BB), MACD, Relative Strength Index (RSI), Stochastic, Stochastic RSI, Simple Moving Average (SMA), Exponential Moving Average (EMA), Volume Weighted Moving Average (VWMA), Ichimoku Cloud, and many others.
The Technicals Widget is available on the platform’s trading page under the order book (Pic. 3):
To check what indicators the Technical Widget is currently tracking, click on [More details] (Pic. 4):
You can learn more about the Technicals widget on the blog and Help Center.
Conclusion
Fear and Greed, two fundamental human emotions, have long been used to describe investor mood. While the CNNMoney Index can be used to gauge stock market sentiment, crypto investors can use the Alternative.me Fear and Greed Index to do the same for the cryptocurrency market.
The Fear vs. Greed Index can produce powerful signals to help traders determine the best time to buy and sell. Bitsgap has a valuable alternative — the Technicals Widget that tracks more than 20 indicators.
Ready to test the Technicals Widget and other great trading instruments?
FAQs:
What Is Fear and Greed Index Bitcoin?
The Bitcoin Fear and Greed Index tracks and estimates the market sentiment for Bitcoin on a scale of 0 to 100. While 0 signals extreme fear and can be a buying opportunity, 100 implies extreme greed and can be interpreted as a sign that Bitcoin is overvalued.
Where Can I Get Crypto Fear and Greed Index App?
The Fear and Greed Index for the stock market can be tracked on CNN here: https://edition.cnn.com/markets/fear-and-greed
The Fear and Greed Index for Bitcoin and altcoins can be tracked on Alternative.me here: https://alternative.me/crypto/fear-and-greed-index/
What’s the Сurrent Bitcoin Greed Index?
The current Bitcoin Fear and Greed index (as of Feb 8, 2023) is 58, which signals Greed.
Is the Fear vs. Greed Index a Reliable Indicator?
Historical evidence confirms the usefulness and reliability of the Fear and Greed Index. However, since the index estimates market timing, it’s unsuitable for the long buy-and-hold strategy.