Best indicators for the crypto market - RSI and Stochastic RSI
Learn how to use oscillator indicators to find the best time to enter and exit the market. Follow the trend and learn how to spot when it is about to change.
RSI and Stochastic RSI indicators should be in the arsenal of your technical analysis instruments as they provide a lot of information about the price direction, potential trend reversal and can indicate whether the trend is weakening or strengthening. In this article, we will cover two main methods of how you can use Stochastic RSI and RSI in tandem to analyze cryptocurrencies.
Before we go straight to use-cases, it is crucial to point out what makes Stochastic RSI different from ordinary RSI and what features unite them and create such a powerful combination:
The Stochastic Relative Strength Index (Stochastic RSI) is a technical indicator. It is created by applying the stochastic oscillator formula (oscillator stands for the construction of a range between extreme minimum and lowest prices within a defined range) to a set of data generated by the RSI indicator. If an ordinary RSI indicator generates values from the asset’s price, Stochastic RSI generates values from the values of RSI. In other words, Stochastic RSI is the indicator of the RSI indicator.
This enables a more sensitive price action analysis to spot overbought and oversold conditions on the market. In contrast, RSI is used to spot convergence and divergence scenarios on the market (the directional relationship between the price and indicator trends).
Below is a visual explanation of the data inflow (Cryptocurrency price ----> RSI values -----> Stochastic RSI)
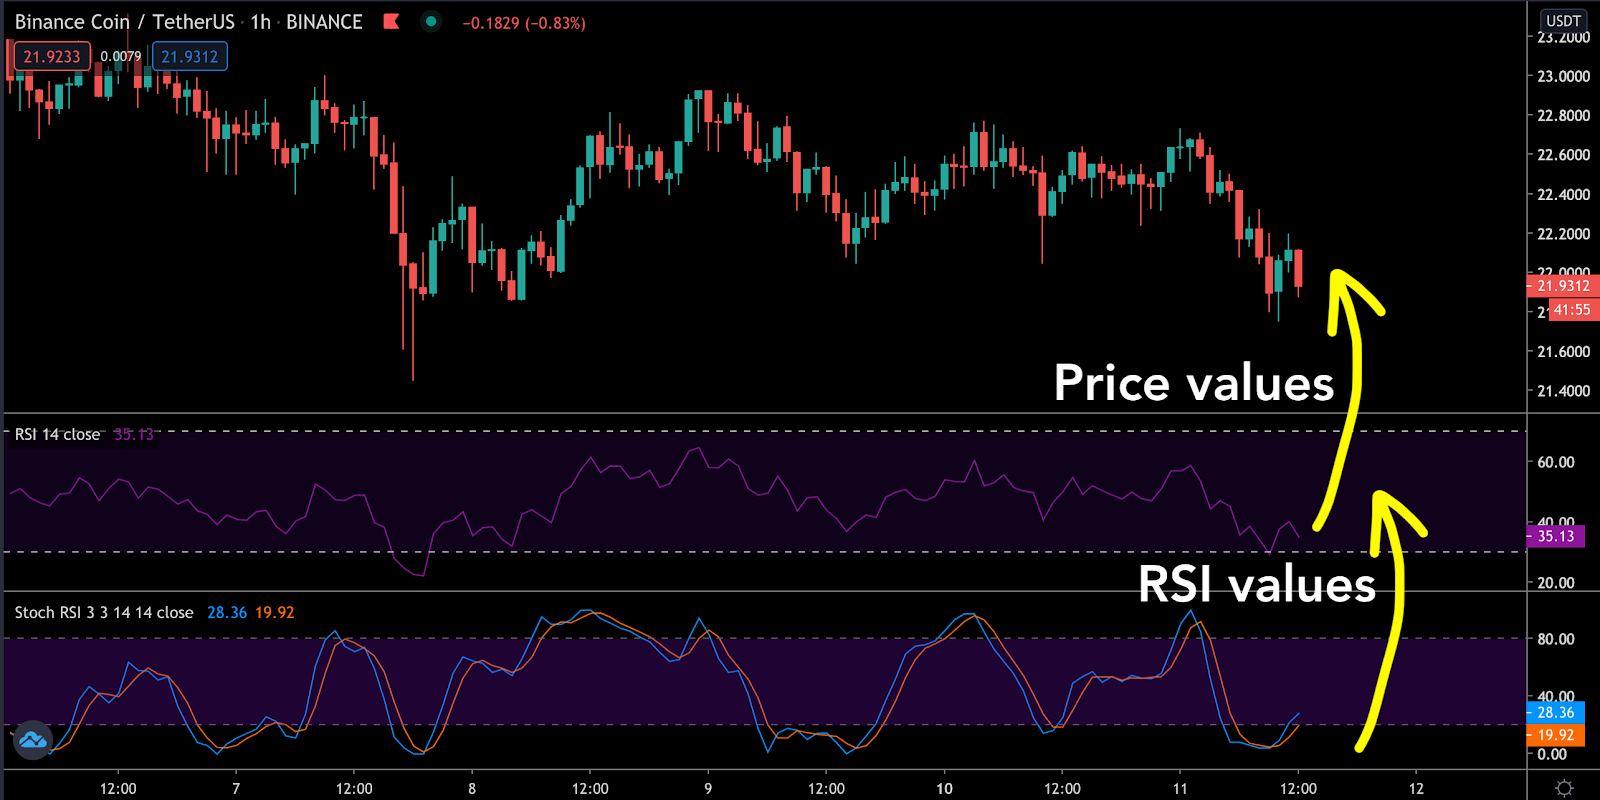
Here is the formula:
Stochastic RSI = (RSI - min[RSI])/(max[RSI]-min[RSI]). In which max[RSI] takes the highest RSI value over the selected period (typically 14 periods), whereas min[RSI] takes the lowest RSI value over the selected period.
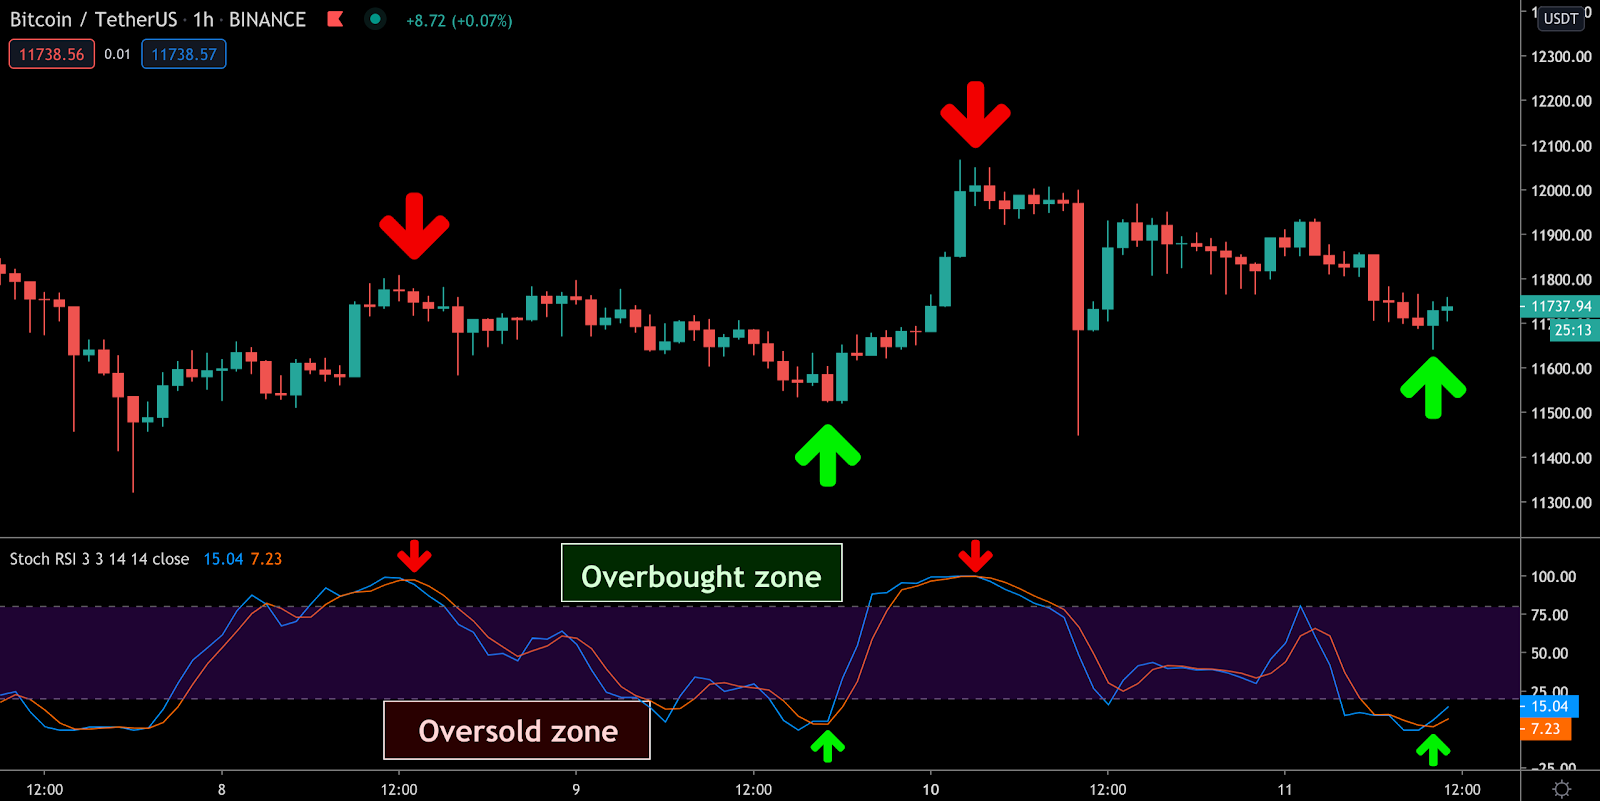
The foremost popular method to use the Stochastic RSI is by looking at overbought and oversold values. The idea is to sell cryptocurrency when the market is overbought and to buy when the market is oversold. When you observe StochRSI’s blue and orange lines crossing-over from above in the overbought zone, this creates a signal that the cryptocurrency’s price is about to revert.
Conversely, when two lines are crossing-over from below, this generates a signal to buy a cryptocurrency as the price is about to bounce off. On the chart below there are two signals to buy and two signals to sell:
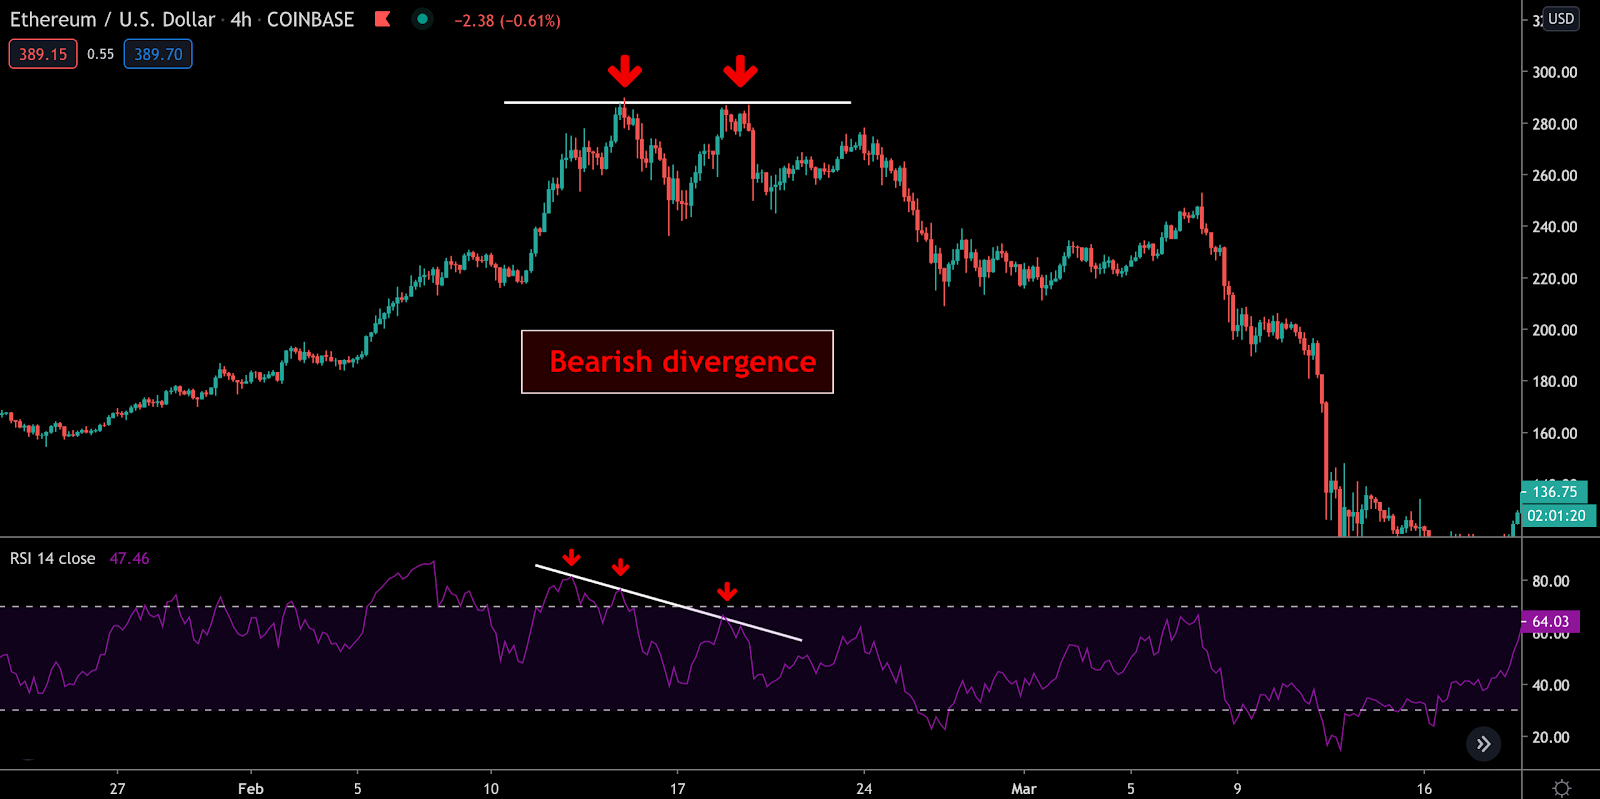
An ordinary RSI indicator in comparison with Stochastic RSI is best suited to find if the trend of a cryptocurrency loses/gains its upside/downside momentum. When highs or lows made by the RSI are different from the highs and lows made by the cryptocurrency price - divergence or convergence occurs.
Below is a chart of ETH trading to USD on Coinbase, and a bearish divergence is spotted, which is known as “Exaggerated bearish divergence”. The price of ETH eventually started to fall. There are different types of convergence and divergence patterns in trading, but in this article, we will use only 1 to make it simple.
Below is a guide on how to spot “Exaggerated divergence” on a chart.
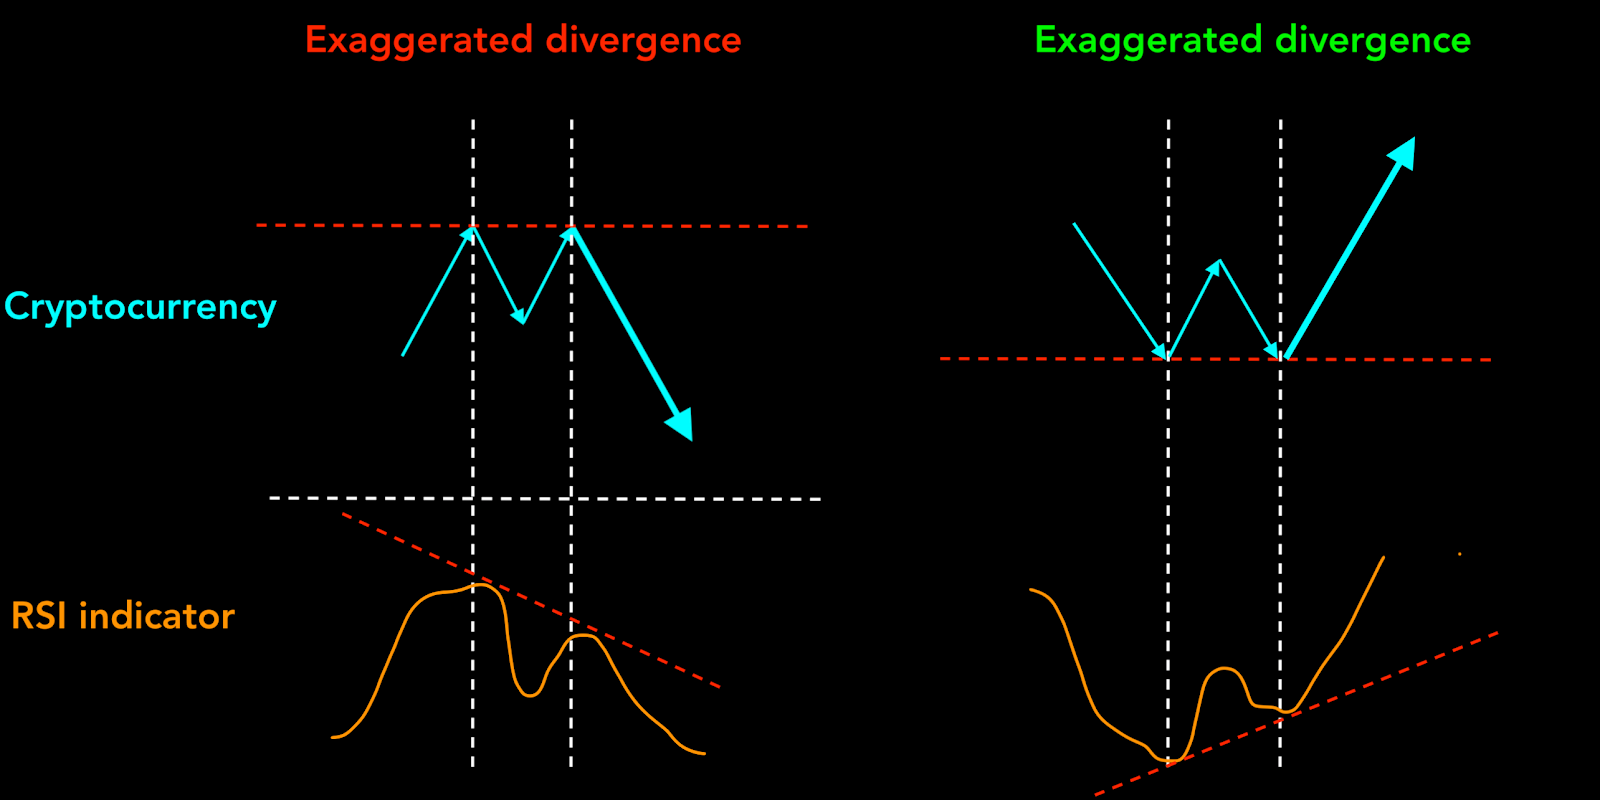
Exaggerated divergence
The next example is BNB/USDT pair on Binance. A bullish “Exaggerated divergence” is spotted as the price of BNB creates two bottoms, while the RSI indicator diverges and has its second value at a higher level.
This is a signal that sellers are losing their battle against buyers, and hence the price can potentially go higher (this is exactly what happened later).
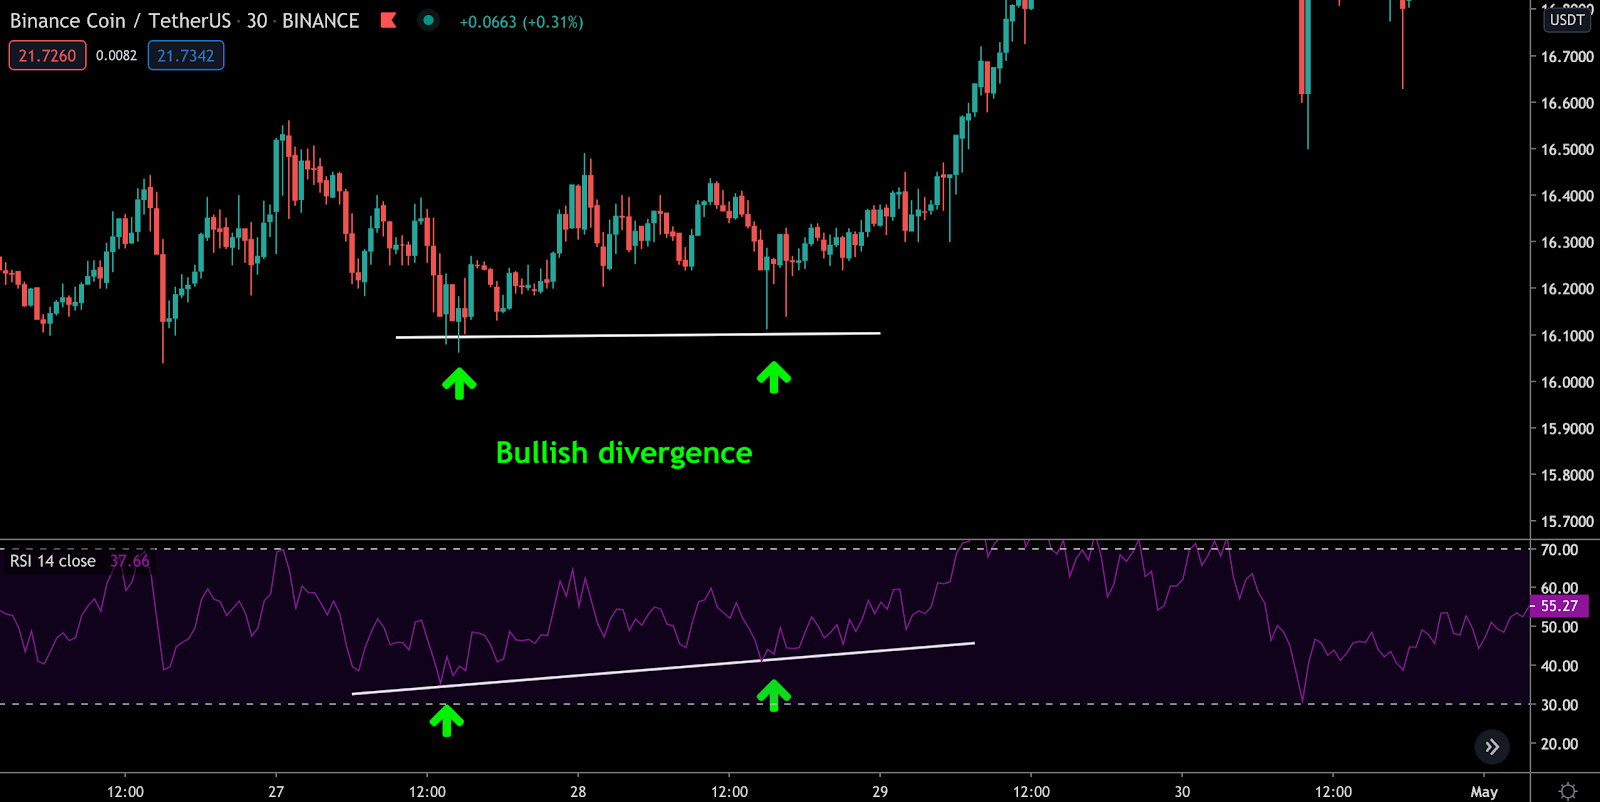
Bullish “Exaggerated divergence"
With the additional help of the Stochastic RSI, we can now find an optimal entry price. It turns out that an optimal price to enter, 16.25$, is right after we spotted a bullish cross-over on the Stochastic RSI indicator.
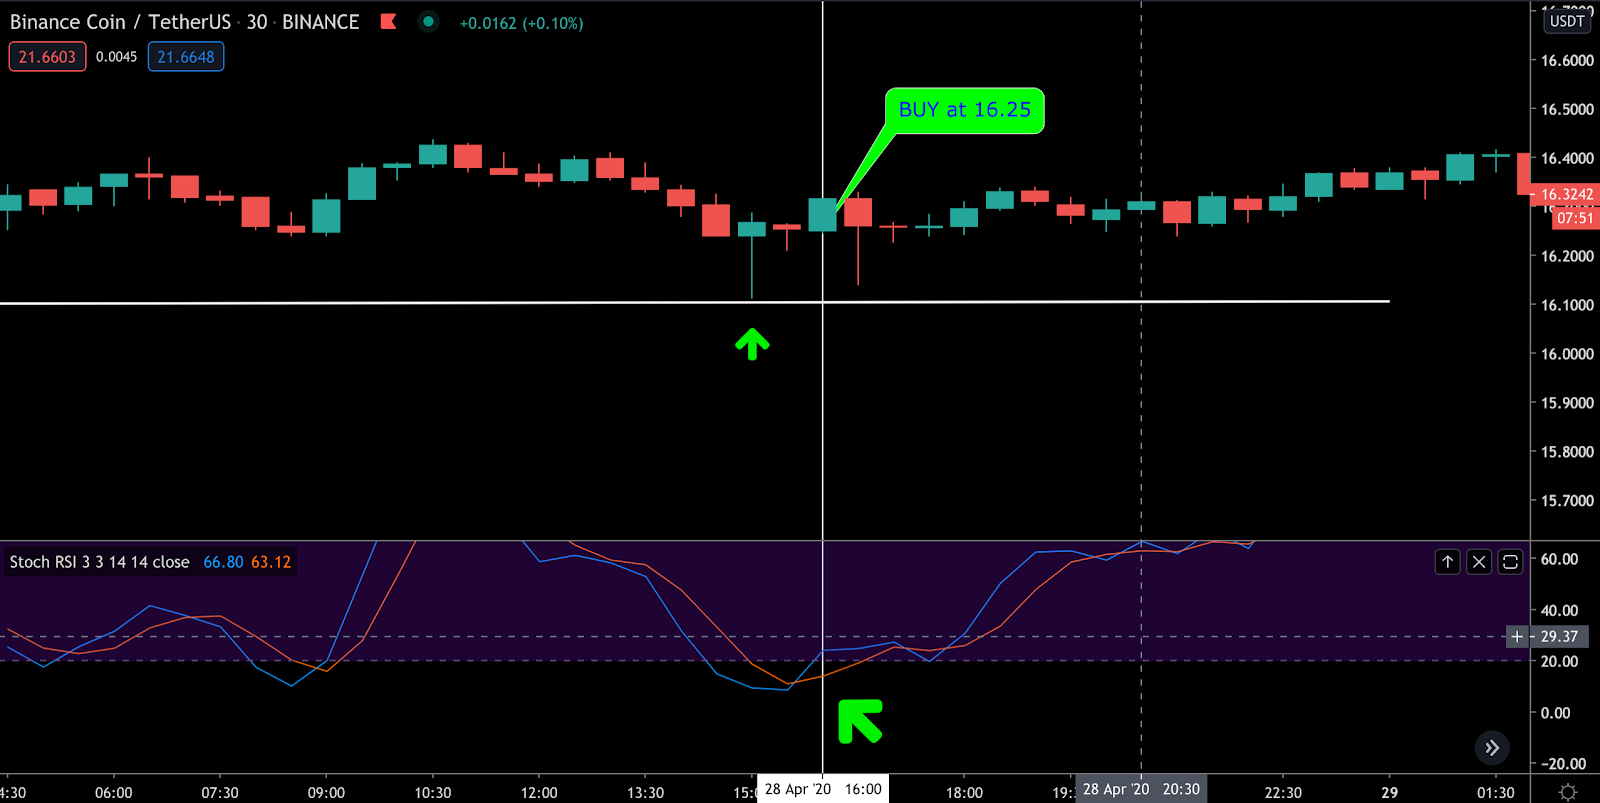
Using RSI to find convergence and divergence can be a powerful instrument to spot trend reversals. Combining RSI with a Stochastic RSI, which is an instrument to detect entry and exit points, creates a trading setup that you can use in manual and automated trading.
Written by Dmitry Perepelkin
