Improve Your Trading Decisions With the Help of 27 Indicators
Bitsgap added the new Technicals widget to its platform. Check your trading decisions on Binance, OKX, and other exchanges with the help of 27 indicators.
What actually keeps so many people from trading? There are countless reasons, but ultimately it’s risk and uncertainty. And that’s its justification.
No matter how much of a pro you are, when you make trading decisions, you’re on your own. So here’s a thought: what if the best experts in the industry backed your estimates? Would you feel more confident?
If so, just read our article—it might really inspire you :)
Introducing Technical Summary
At Bitsgap, we do anything to get you more confident while trading, so we’re introducing a new instrument called Technicals (or Technicals Summary).
There are many ways to make a good trade. You can use technical analysis, fundamental analysis, or a combination of both. And you’ll likely use a variety of indicators to help you decide when to buy and sell. Or how to configure your DCA and GRID trading bot.
That’s where the Bitsgap Technicals tool comes in. It combines and averages the values of the most popular oscillators and indicators, so you don’t have to do all the math yourself.
Technicals: Under the Hood
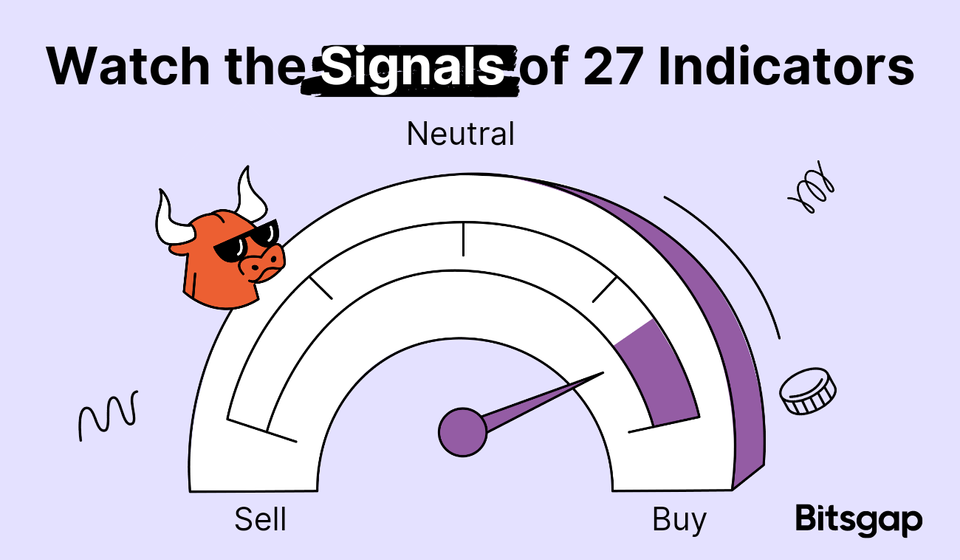
The central concept of this amazing feature is to take the feedback from the 27 indicators and oscillators: Stochastic, Awesome Oscillator, different Moving Averages, and so on. The Technicals sum their Buy/Sell/Neutral ratings up, averaging them into one intuitive gauge.

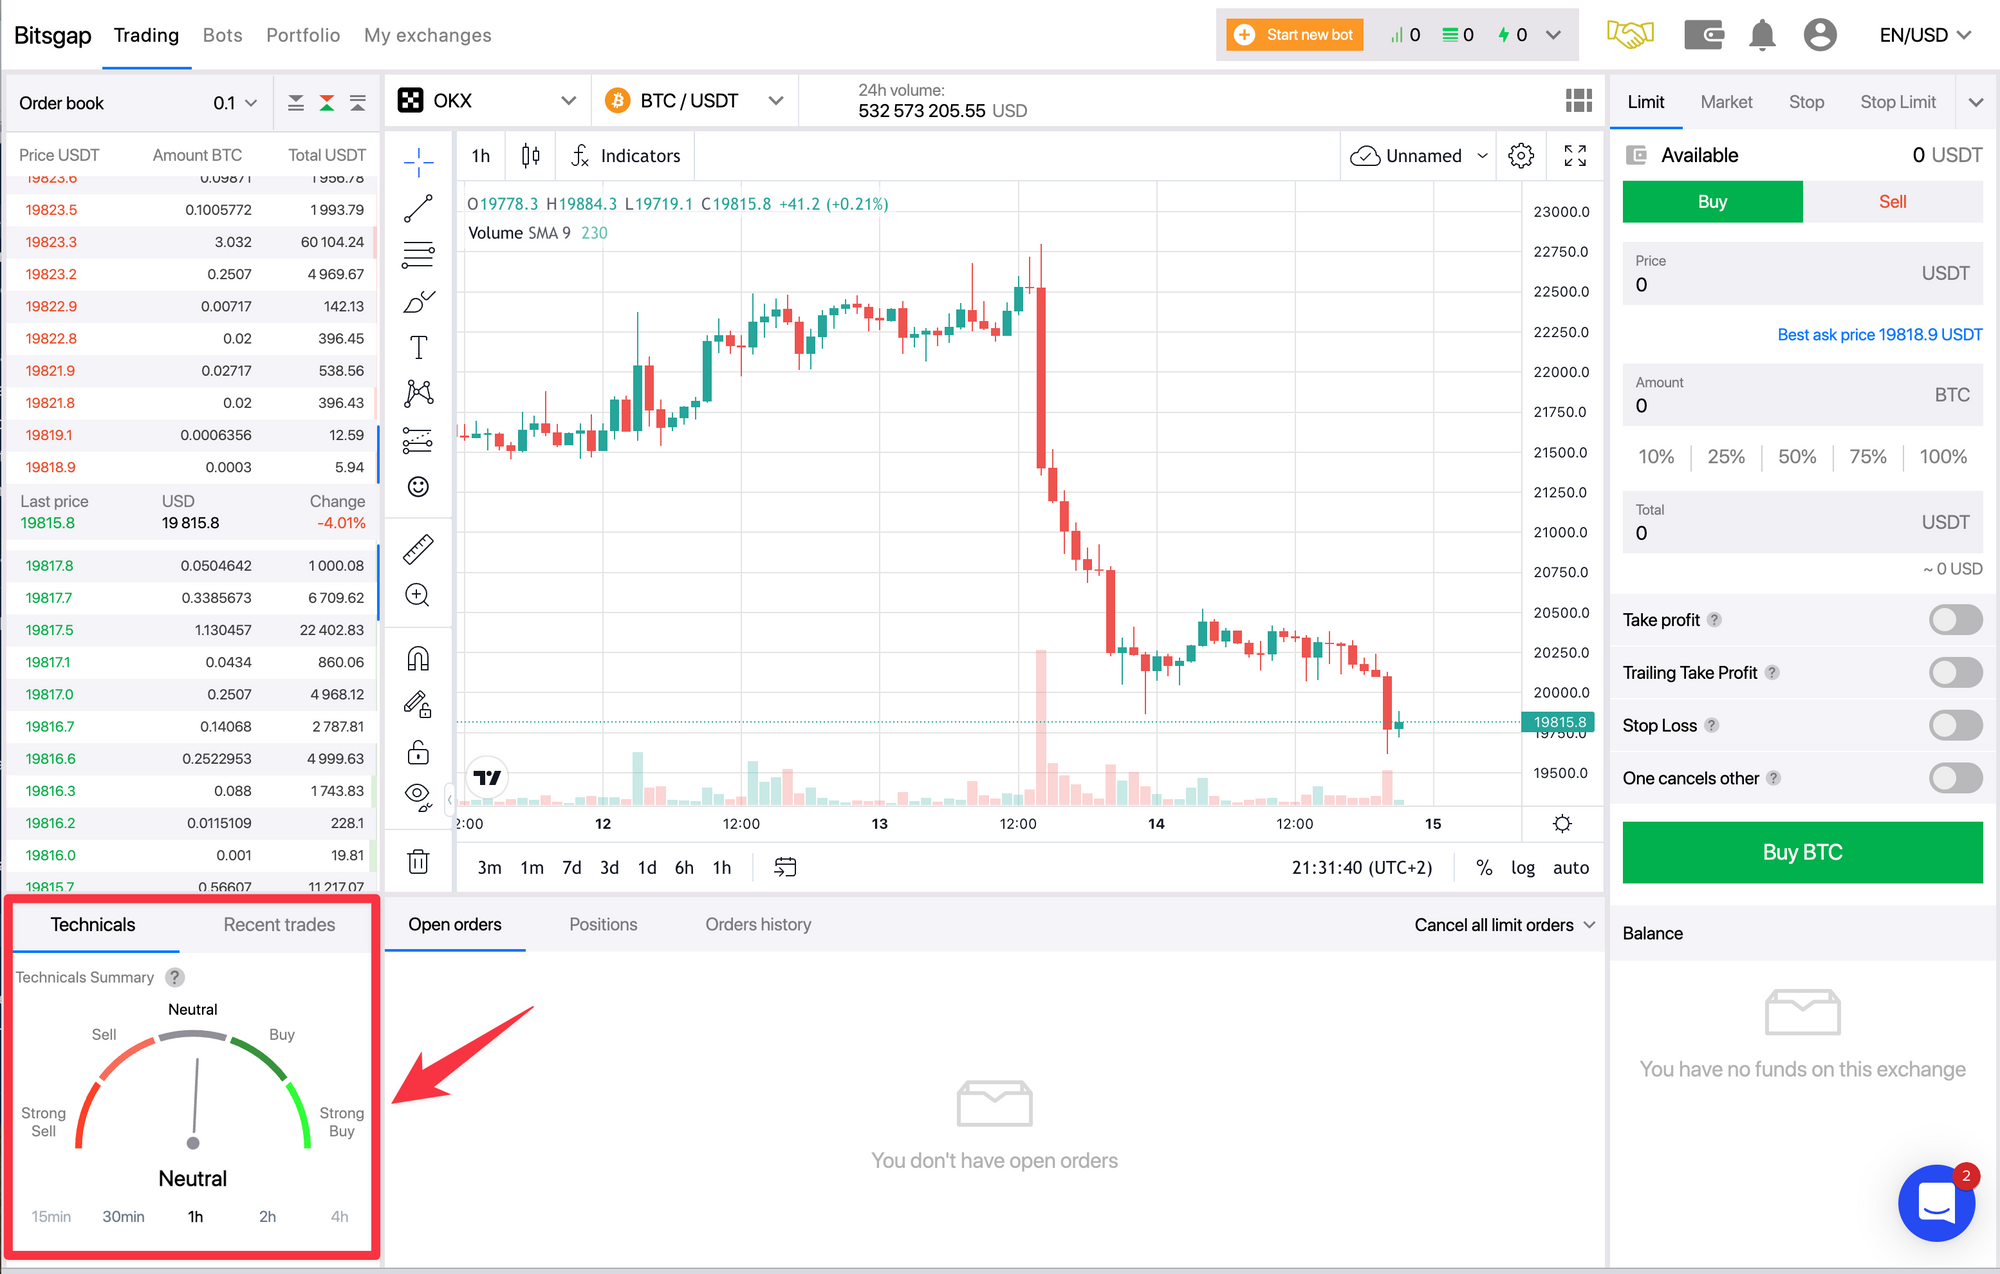
We made the interface of this widget as intuitive and straightforward as possible. You’ll easily find it in the platform’s interface, and there are just five scale divisions that show the following:
- Strong Buy 👍👍 The majority of indicators generate Buy signals.
- Buy 👍 Most indicators generate Buy signals.
- Neutral ✋The number of Buy and Sell signals is approximately the same (50/50).
- Sell 👎 Most indicators generate Sell signals.
- Strong Sell 👎👎 The majority of indicators generate Sell signals.
Advanced Technicals
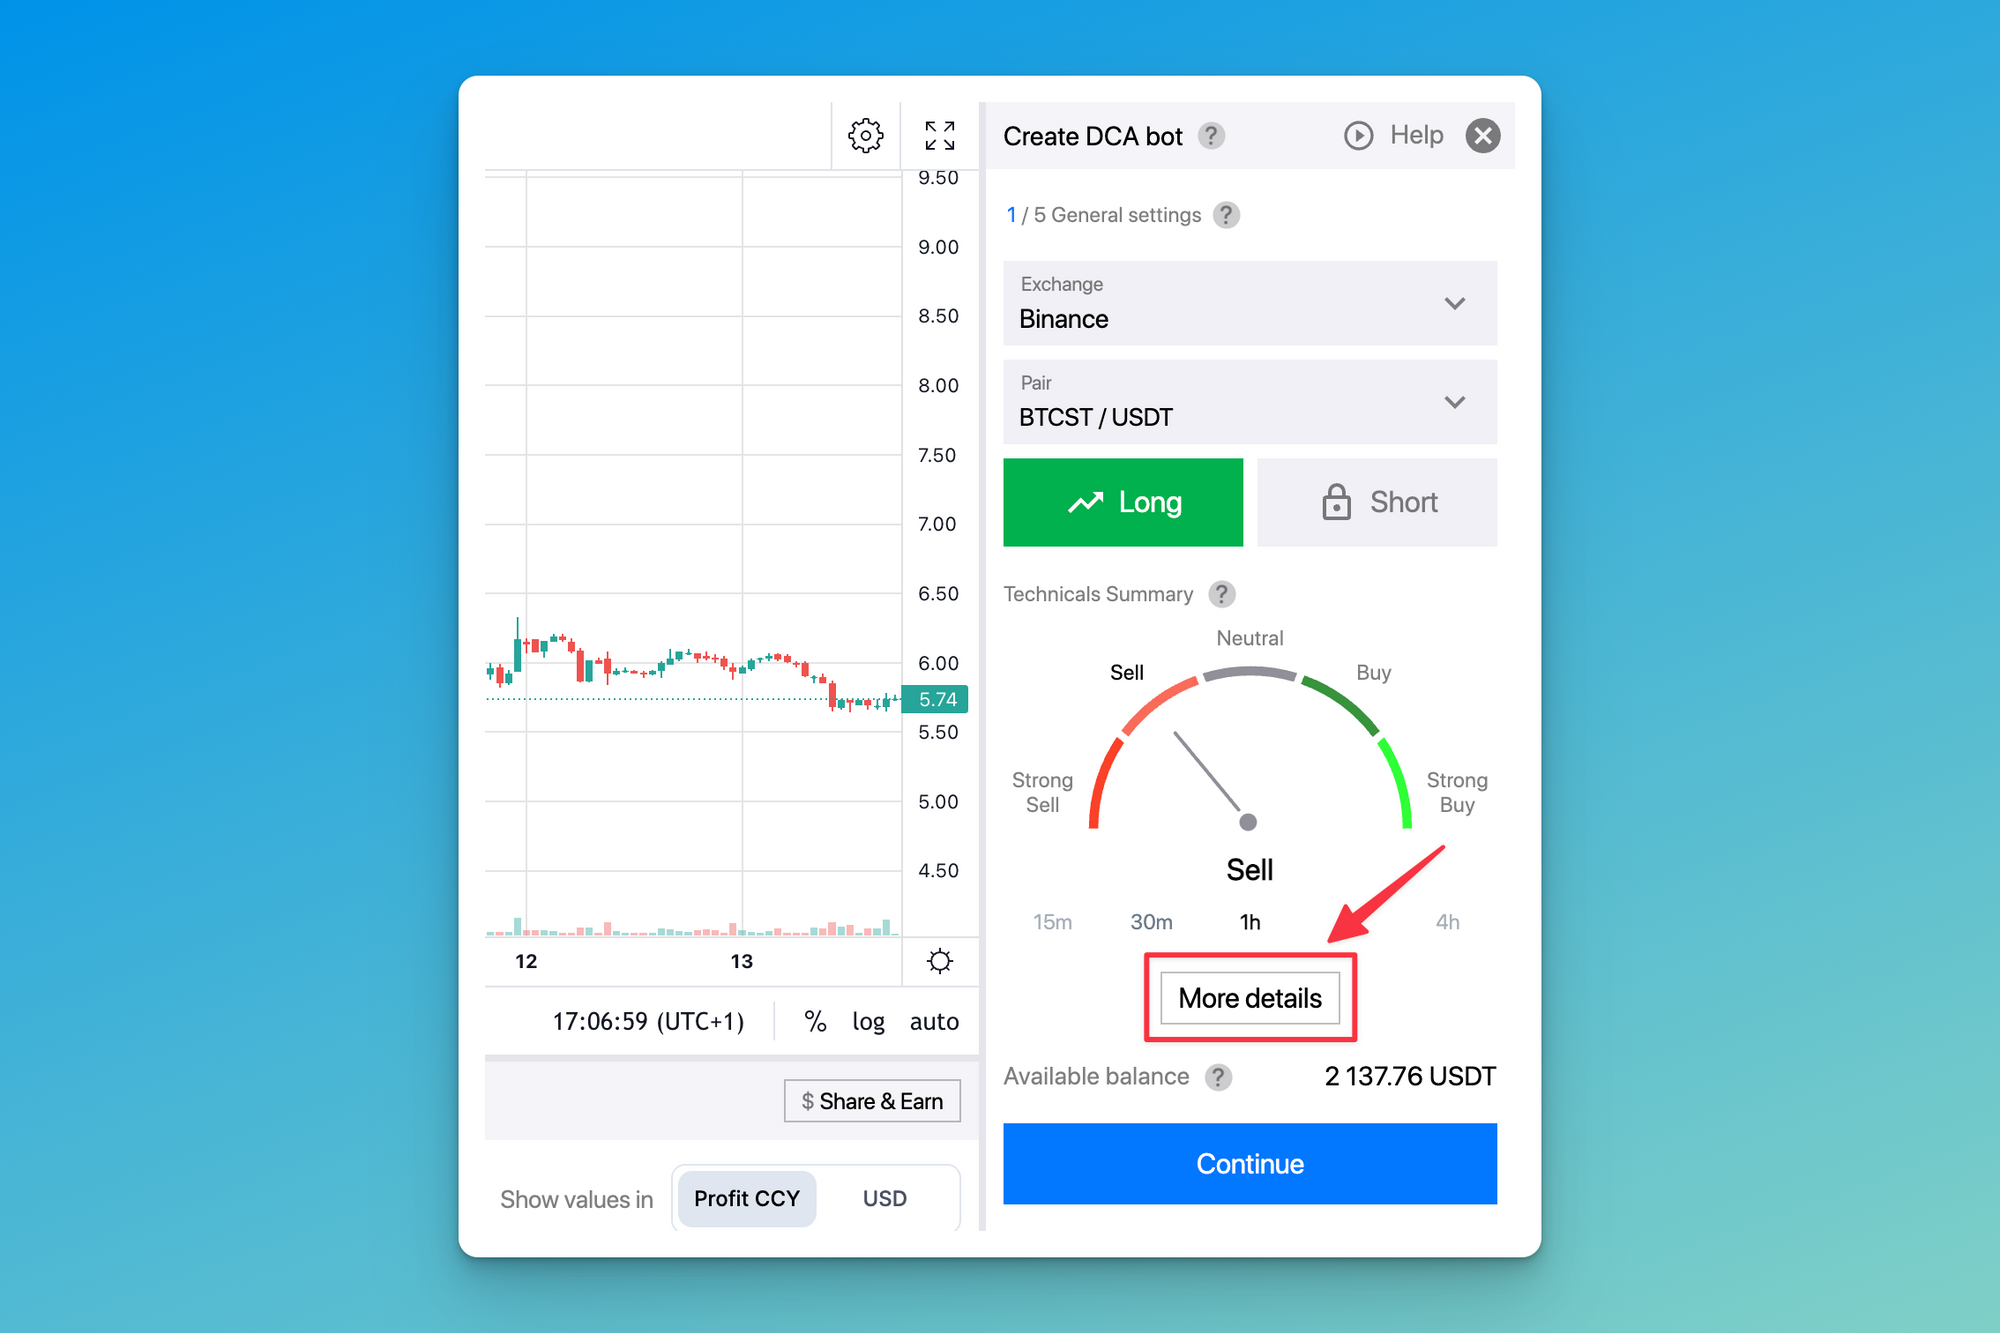
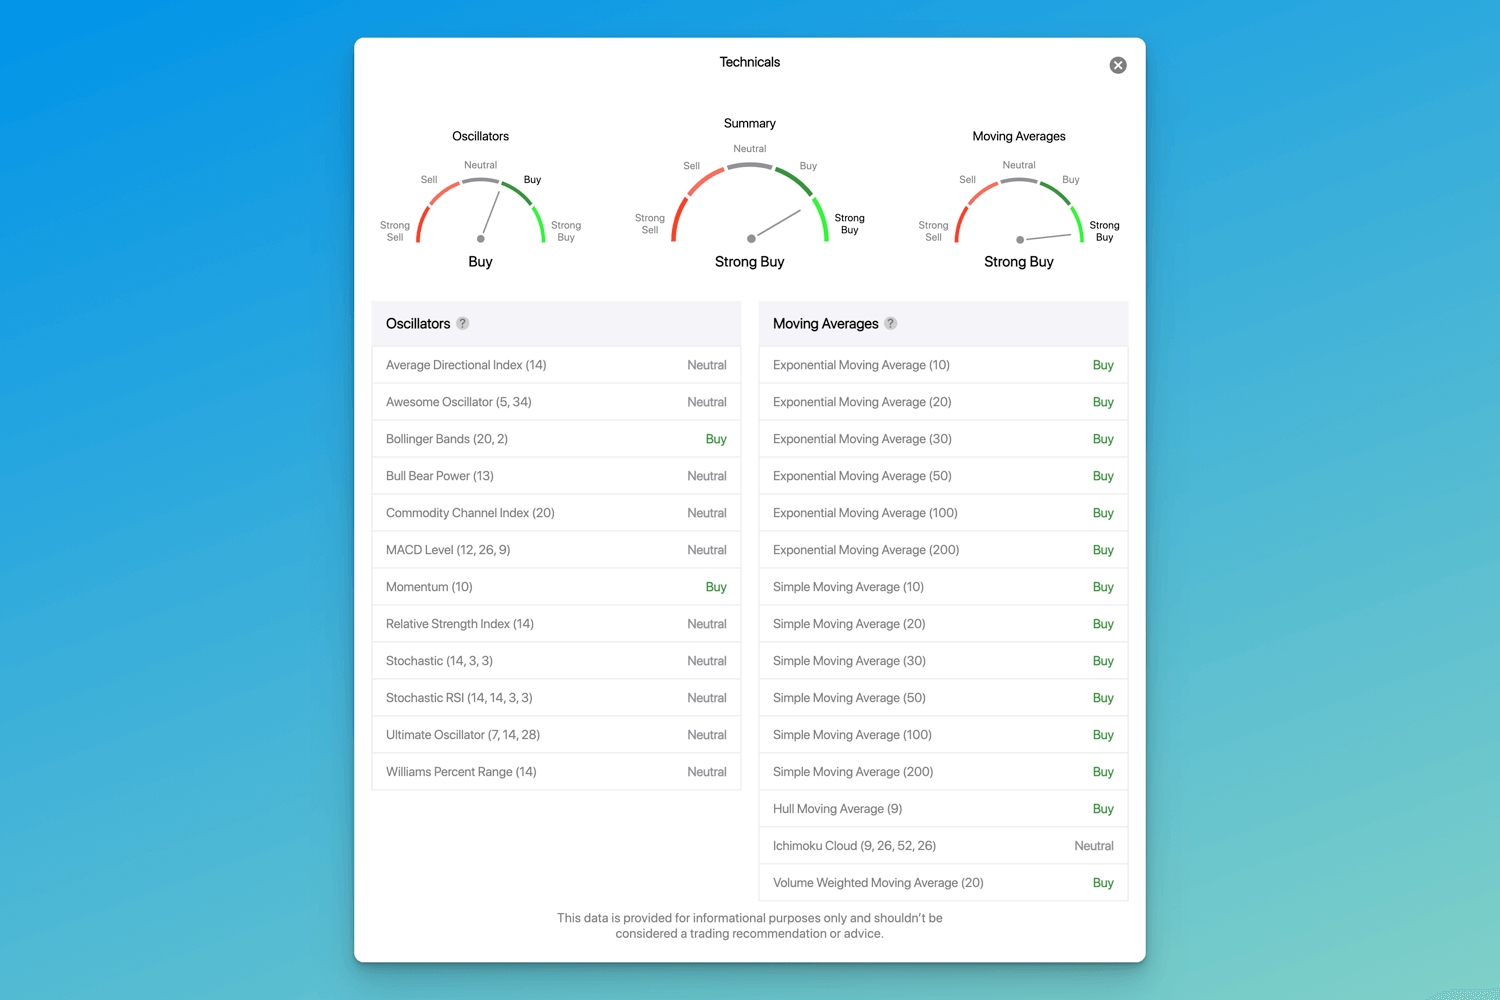
You can also check what indicators are used in calculating the final signal: Buy, Sell, or Neutral. To see them, click on the “More Details “button under the widget.

The appearing pop-up reveals the tracked indicators and oscillators, their settings, and generated signals.

Advanced Technicals is a fantastic tool to quickly find a signal that your favorite indicators give for a certain timeframe without looking for them on the chart.
Along with receiving a summarized forecast, you can also check specific indicator signals. This is especially handy if you need to act quickly. With Advanced Technicals, you can now be more confident in trading than ever!
Check Out Your Strategy and Learn More
With Technicals, you also get an at-a-glance overview of the indicators’ averaged values through the different timeframes, up to one day. Currently, this widget is available in the Trading mode and when setting up the DCA Bot.
It will help you estimate your trading strategy's effectiveness for the additional time periods when trading any asset from Bitcoin to Solana. This way, you can massively increase the analytical reasoning behind your choices.
If you’re curious about the specific details of the Technical Summary widget, find them in our Help Center. Or just log in to Bitsgap by clicking the button below and check out this feature in action.
Disclaimer: Please consider that the Technical Summary readings can’t be counted as trading advice or recommendation. You make your trading decisions at your own risk.
