
Using Multiple Time Frames: Advantages & Examples
Explore multiple time frame analysis, where every tick tells a story, and learn how to harness this powerful strategy to refine your trading decisions and maximize your market edge.
Technical analysis provides traders the analytical tools to predict future price movements using historical data. However, one strategic way to enhance the power of this analysis is to examine multiple time frames. Studying different time frames grants a more complete market view, empowering better trading decisions that can improve risk management and uncover profit opportunities.
In this guide, we will explore the idea of incorporating multiple time frames into trading. We will explain effective techniques for conducting technical analysis across short-term and long-term charts. Additionally, we will demonstrate this approach in action by analyzing a particular trading pair across various time perspectives.
What Is Multiple Time Frame Analysis and Multiple Time Frame Trading?
Multiple time frame analysis is a method used in technical analysis to evaluate the price movement of a financial asset across different time frames. This approach involves looking at the same asset under several time periods (e.g., 1-hour, 4-hour, daily, weekly charts) to gain a comprehensive view of the market's trends and potential turning points. The rationale behind this technique is that different time frames may show varying market dynamics, and by analyzing multiple layers, traders can make more informed decisions.
What is a time frame?
Time frames refer to the durations over which market data is aggregated and charted. Each time frame represents a specific length of time per chart bar or candlestick, showing how the price of an asset has moved within that period. The choice of time frame can vary widely depending on the trader’s strategy, objectives, and the market being analyzed.
Common Trading Time Frames
1. Intraday Time Frames
- 1-Minute Charts: Each bar or candle represents one minute of trading. This is extremely short-term and used predominantly by high-frequency traders.
- 5-Minute Charts: Each bar or candle shows the price movement for five minutes. Used by day traders for more granular analysis without too much noise.
- 15-Minute Charts: Each bar or candle represents fifteen minutes. It’s common among day traders who want a broader view than 5-minute charts.
- 30-Minute Charts: Every bar or candlestick shows half an hour of price data. This strikes a balance between detail and over-arching market trends.
- 1-Hour Charts: Each bar or candle represents one hour of trading. It’s useful for day traders or short-term traders looking to hold positions for a few hours to a day.
2. Daily Time Frames
- Daily Charts: Each bar or candle represents one day of trading. This is the most common time frame used by swing traders and investors looking at medium-term trends.
3. Long-Term Time Frames
- Weekly Charts: Each bar or candle aggregates a week of price data. It’s favored by traders and investors who hold positions for several weeks or months.
- Monthly Charts: Each candle or bar represents one month of trading activity. This is used for long-term investment analysis and strategic planning, providing a high-level view of the market’s movements over extended periods.
4. Other Time Frames
- Tick Charts: Instead of being based on a time interval, each bar or candlestick is drawn after a certain number of transactions (or ticks) have occurred. This is highly specific and used primarily by professional traders in very liquid markets.
- Range Bars: These bars close after the asset moves a predefined price range, regardless of the time it takes to move that range. They help eliminate noise by focusing purely on price movements.
Choosing the Right Time Frame
The choice of time frame is crucial and varies depending on the trader's style:
- Day Traders typically use 1-minute to 1-hour charts because their strategy involves buying and selling securities within the same trading day.
- Swing Traders often prefer daily charts as they hold positions for several days to several weeks, needing to understand the medium-term trends.
- Position Traders and Long-Term Investors lean towards weekly and monthly charts to capture overarching trends and make decisions based on long-term projections.
Here’s a summary table that outlines which time frames are typically used by traders depending on their trading style:
Fig. 1. Time frames for different trading styles.
Each time frame offers a different perspective on the market, and often, traders will analyze multiple time frames to refine their trading strategies and improve decision-making, applying the principle of multiple time frame analysis.
How Multiple Time Frame Analysis Works
- Selection of Time Frames: Traders select several time frames to analyze, typically a combination of long, medium, and short durations. For instance, a trader might look at weekly charts for the long-term trend, daily charts for the medium-term trend, and hourly charts for entry or exit points.
- Identifying Trends: The trader identifies whether the market is trending up, down, or sideways in each selected time frame. Consistency across time frames in trend direction can indicate stronger signals.
- Confirmation: Using multiple time frames helps in confirming trade signals. For instance, if a buying opportunity is spotted on a short-term chart, confirmation from medium-term and long-term charts can enhance the reliability of the signal.
- Timing Entries and Exits: Shorter time frames are often used to fine-tune entry and exit points, taking advantage of the broader trend visibility provided by longer time frames.
👉 Multiple Time Frame Trading is the application of insights gained from multiple time frame analysis into actual trading strategies. Traders use this approach to align their trades with trends identified across different time frames, enhancing the probability of successful trades.
Advantages of Multiple Time Frame Trading
- Enhanced Decision Making: Provides a more holistic view of market movements and trends.
- Reduction in Risk: By confirming trends and signals across multiple time frames, the likelihood of false signals is reduced.
- Strategic Trade Management: Helps in planning better entry and exit strategies, optimizing trade timing.

How to Implement Multiple Time Frame Trading
- Choose Relevant Time Frames: Depending on trading style (day trading, swing trading, position trading), select appropriate time frames that align with your trading goals.
- Start with the Longest Time Frame: Analyze the longest time frame to understand the overall market trend. Use this to establish the direction of trades in shorter time frames.
- Refine with Medium Time Frame: Use a medium time frame to gauge the strength of the trend, looking for patterns or factors that support the findings from the longest time frame.
- Execute Based on the Shortest Time Frame: Finally, use the shortest time frame to make precise trade decisions, such as exact entry points and stop-loss orders.
Multiple time frame analysis and trading enable traders to see the 'bigger picture' and the finer details of market movements simultaneously. This method can lead to more strategic and informed trading decisions, potentially increasing the success rate of trades across various markets.
Example of Technical Analysis Using Multiple Timeframes
Let’s examine the following charts that show the price action of Bitcoin (BTC) against USDT on different timeframes including 5 minutes, 1 hour, 12 hours, and 1 day.
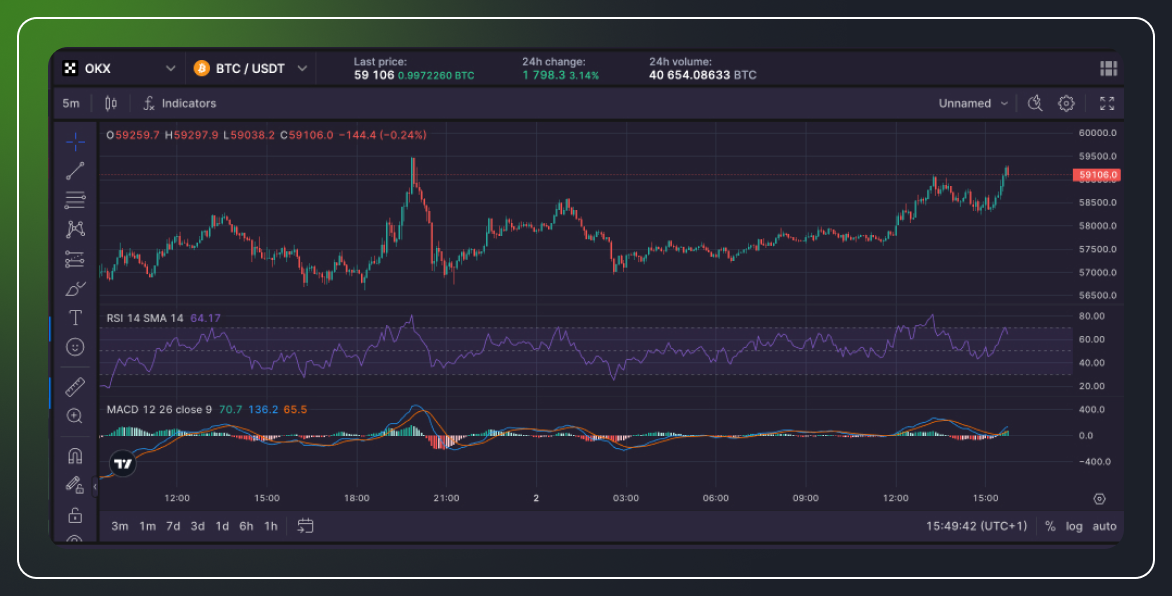
Starting with the 5-minute chart, we see that BTC experienced some volatility with price swings in both directions. The RSI is currently at 64.17, which indicates that the market is slightly overbought but not excessively so. The MACD is above the signal line and is moving upwards, suggesting that the momentum is currently bullish.
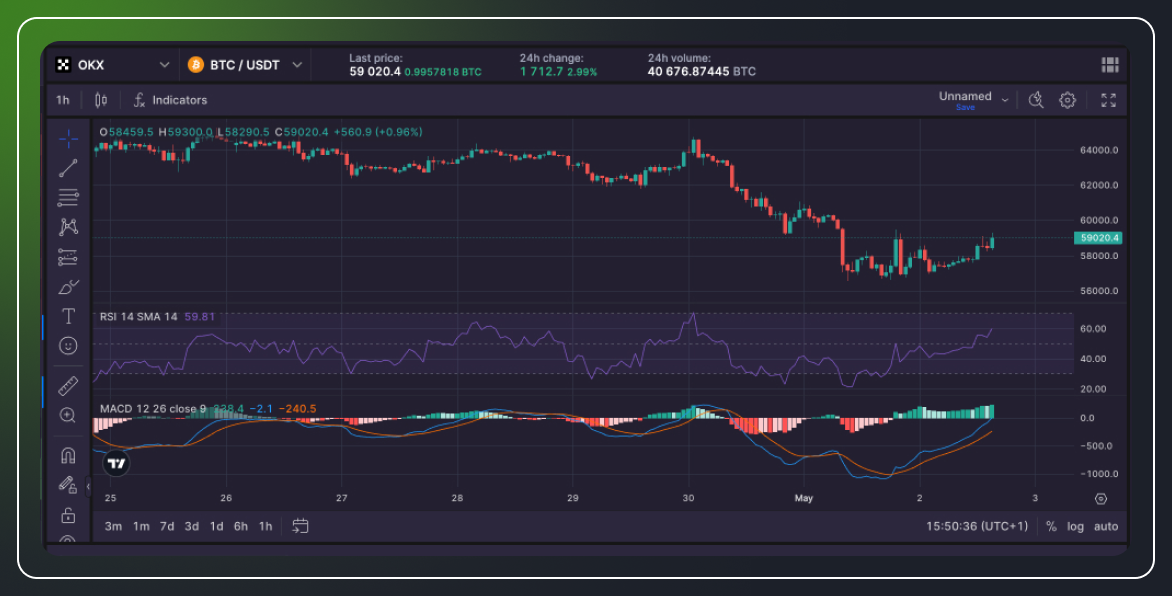
On the 1-hour chart, the price has been moving in a sideways range between approximately $57,000 and $59,000. The RSI is at 59.81, indicating that the market conditions are neutral. The MACD has just crossed above the signal line, indicating a possible bullish momentum in the short term.
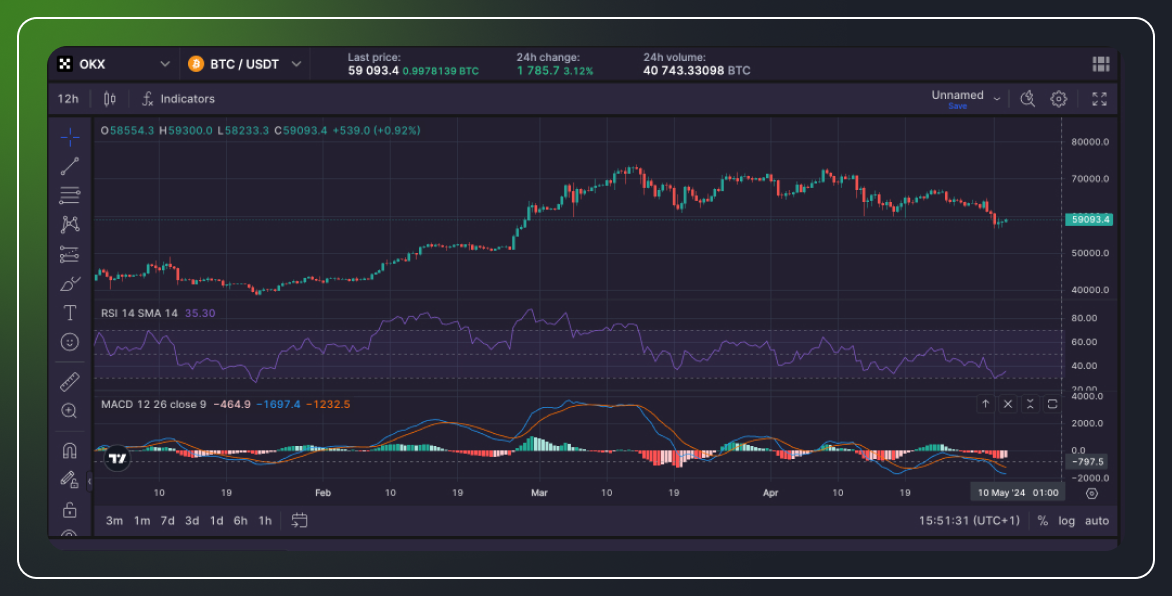
Moving to the 12-hour chart, we see a more bearish picture. The RSI is at 35.30, which is close to the oversold territory, and the MACD line is below the signal line and has been declining, suggesting bearish momentum over the past few days.
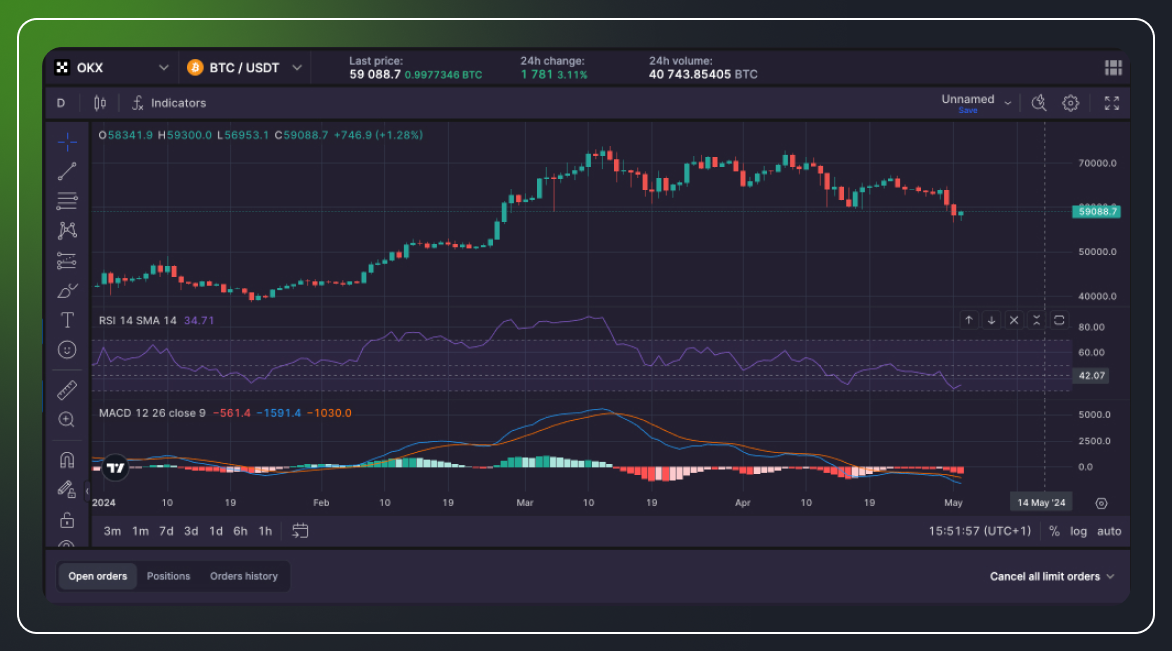
Lastly, on the 1-day chart, the price action shows a downtrend from highs near $64,000 to current levels around $58,000. The RSI is at 34.71, which is close to the oversold region. The MACD is bearish, as it is below the signal line and has been diverging.
Overall, the multi-frame technical analysis suggests that there is short-term bullish momentum on the lower timeframes, but the higher timeframes show a bearish trend. This could mean that while there may be temporary upside movements, the longer-term trend may still be downwards.
Conclusion
Multiple time frames analysis is a powerful technique that involves examining the same trading pair or asset through different temporal lenses — from minutes to days, weeks, or even months. This approach not only enhances the depth of market analysis but also significantly improves decision-making in trading. By integrating short-term, medium-term, and long-term perspectives, traders can identify more reliable trading signals, discern underlying trends, and better time their entries and exits.
The benefits of multiple time frames analysis are manifold. It helps in confirming trends, pinpointing counter-trend opportunities, and managing risk more effectively.
To help traders realize all the advantages of in-depth technical analysis, Bitsgap offers a robust suite of advanced tech. Our platform provides sophisticated trading bots, smart order types, and an array of charting tools — all designed to support trading across various time frames. Additionally, Bitsgap's portfolio management functions enable seamless monitoring and strategy adjustments across multiple markets. Whether you trade intraday, swing trade, or invest long-term, experience how Bitsgap can empower more informed and strategic decisions. We invite you to register for a free, seven-day trial of Bitsgap!
FAQs
What Is the Best Time Frame for Day Trading?
For day traders, the best time frame often depends on their specific strategy and the level of market detail they require. A commonly preferred time frame is the 15-minute chart, as it provides a good balance between showing enough data for decision-making without too much granularity. This allows traders to see trends and patterns that can guide intraday trading decisions. Additional time frames like 1-minute and 5-minute charts are also popular for more precise entry and exit points, while the 1-hour chart can be useful for a broader view of the day's market trend.
What Is the Best Time Frame for Scalping?
Scalping involves making very rapid trades to take advantage of small price movements. Therefore, scalpers generally use very short time frames. The 1-minute chart is most commonly used as it offers the up-to-the-minute price actions needed for this high-speed trading style. Some scalpers might also use 5-minute charts to verify broader market trends or to manage risk more effectively.
What Is the Best Time Frame for Swing Trading?
Swing traders, who hold positions for several days to several weeks, benefit from using the daily chart. This time frame allows them to analyze the medium-term trends and better understand the market movement without the noise of shorter time frames. For additional context or to fine-tune entry and exit points, 4-hour and 1-hour charts can also be valuable.
What Is the Best Time Frame for Position Trading?
Position traders hold investments for several weeks to months and generally use the weekly chart to identify and follow longer-term trends. This time frame helps in understanding the bigger market movements and underlying trends without the distraction of short-term fluctuations. Daily charts can also be used to refine decisions about when to enter or exit positions.
What Is the Best Time Frame for Long-Term Trading?
For long-term traders, who may hold positions for several months to years, the monthly chart is the most advantageous. It provides a high-level overview of long-term trends and market behavior, essential for strategic planning and decision-making. Weekly charts can complement this by offering a slightly more detailed look at the market, useful for spotting finer trends or timing the execution of trades.
